
The rise of private wealth and the decline of public wealth in rich countries, 1970-2020
“Nations have become richer, but governments have become poor”
One way to understand inequalities is to focus on the gap between the net wealth own by governments and net wealth owned by the private sector. Over the past four decades, world nations have become significantly richer, but their government have become significantly poorer.
The share of wealth detained by public actors is close to zero or negative in rich countries, meaning that the totality of wealth is detained by private individuals. This trend has been magnified by the Covid crisis during which governments borrowed the equivalent of 10-20% of GDP to the private sector. The current weak wealth position of governments has important implications for governments’ ability to tackle inequality in the future, as well as key challenges of the 21st century such as facing climate change.
What is wealth and what does owning capital mean?
Contrary to national income, which is a flow, national wealth is a stock, an economic resource that has been accumulated over time. More precisely, wealth arises from both capital accumulation (made possible by savings that are invested) and price effects (reflecting changes in asset prices in the absence of any saving). Capital can be accumulated in many forms: residences and buildings, equipment and machinery, intangible capital such as software. Price effects reflect the dynamics of market perceptions of various types of assets. The value of a house might increase or decrease without any improvements being made by its owners, simply because there is a shortage of housing in the area1.
In national accounts, wealth can take either of two forms: financial or non-financial assets. Financial assets are contractual financial claims such as bank deposits, stocks, bonds and equities. Non-financial assets, by contrast, refer to assets such as land, housing, machinery and intangibles, which typically derive their value from their direct physical or immaterial properties. When studying wealth, it is always important also to think about financial liabilities, i.e. debts: the net wealth of a country or an individual is always the sum of their financial and non-financial assets, minus their debts (see Box 3.1).
Two types of actors can own wealth: private actors and public actors. By definition, the wealth of a country is equal to the sum of net private wealth and net public wealth. Private actors are individuals who own firms, bonds, housing, etc. in their own names, and private foundations and institutions such as religious organizations, which can also own assets and liabilities2. Public actors are local and central governments around the world. Their assets can take many forms: public hospitals and roads, as well as bonds and publicly owned firms, for instance. And what about the corporate sector, that is firms? Firms can indeed own capital, and other firms (and the assets of these firms) but ultimately, a private or a public actor has to own these firms3 .
Given these definitions, it follows that behind every dollar, euro or yuan of asset owned in the world, there is an individual or a group of individuals controlling the asset and making decisions about how it should be used: wealth on earth is not kept by the planet Mars. Broadly speaking, being the proprietor of capital means two things: receiving the income generated by the capital, and choosing how and where this capital is to be invested. Ownership of capital can come with significant power over individuals who use that capital (workers using machines, tenants living in houses, drivers using roads, etc.). It is important to keep in mind that the very notions of private and public property, and the power relationships associated with them, can have very different meanings in different countries and at different times. For instance, private property in land or housing can take very different forms, depending on the extent of tenant rights, the length of the lease period, the capacity of landlords to change the rent or to expel the tenant unilaterally, etc. Similarly, corporate property may not have the same meaning and implications for workers in countries where shareholders control all voting rights as in countries where workers’ representatives have substantial voting rights on corporate boards (such as in the Nordic countries and Germany).
Public property can also have very different meanings depending on the country or period under consideration, and the prevailing political system: public property in Russia today, for example, is very different from public property there 40 years ago, or from Norway’s public sovereign fund (see below). The details of the legal, political and governance systems are important in understanding the interplay between property structures and relationships of power among social groups. To understand these dynamics properly, sound data are necessary, but not sufficient. We also require a good understanding of a country’s institutions and how these affect political and social inequality4.
Ultimately, decisions about what can be owned privately or publicly, and the various constraints placed on property, must be subject to democratic debate. Yet they are often neglected in public discussion, because of financial opacity and lack of data, because the discourse seems too technical, or because those who possess wealth see little interest in discussing such fundamental questions. This Report provides historical and international data and analysis in order to make such debates as informed as possible.
Until recently, it was difficult to get a good grasp of the dynamics of wealth across countries and over time, because of a lack of data. In the previous Inequality Report, we presented harmonized annual series of wealth–income ratios for the largest industrialized economies in the World from 1700 onward, and for several emerging countries over the past four decades, including former communist countries, before and after their transition to capitalist regimes5. That work has been extended for this edition of the report, by researchers associated with the WID.world database. Thanks to the work of Luis Bauluz, Thomas Blanchet, Clara Martinez Toledano and Alice Sodano, in particular, the WID.world database now contains wealth information for nearly all countries in the world over the recent period.
We should stress, however, that this is an area where we still need to make a lot of progress. In particular, we know too little about the structures of public, private and foreign ownership in many areas of the developing and emerging world, especially in Africa, Latin America and Asia. This is why some of our data starts early in the 20th century (or before), while for other regions our estimates only begin in the 1990s.
Global private and public wealth: Insights
The best way to study the volumes of and changes to wealth at the national and global levels is to focus on the ratio of national wealth to national income. The reason is simple: if the wealth of a country increases at the same speed as its national income, then the relative importance of wealth in the economy is unchanged, even though the level of wealth has increased. In this case, the growth in wealth simply reflects normal economic growth. Focusing on wealth– income ratios (the value of national wealth divided by national income) allows us to disentangle the growth of wealth from the growth rate of the economy. When wealth– income ratios increase, it means that the value of total assets is growing faster than incomes; societies are either accumulating more capital or the price of assets is increasing. We can also focus separately on the private wealth-to-income ratio (the value of private wealth divided by national income) and the public wealth-to-income ratio (the value of public wealth divided by national income). By definition, total wealth in a country is equal to the sum of private and public wealth. When private wealth-to- income ratios increase, it means that the relative weight of those who possess capital is overtaking the weight of those who only live off their incomes.
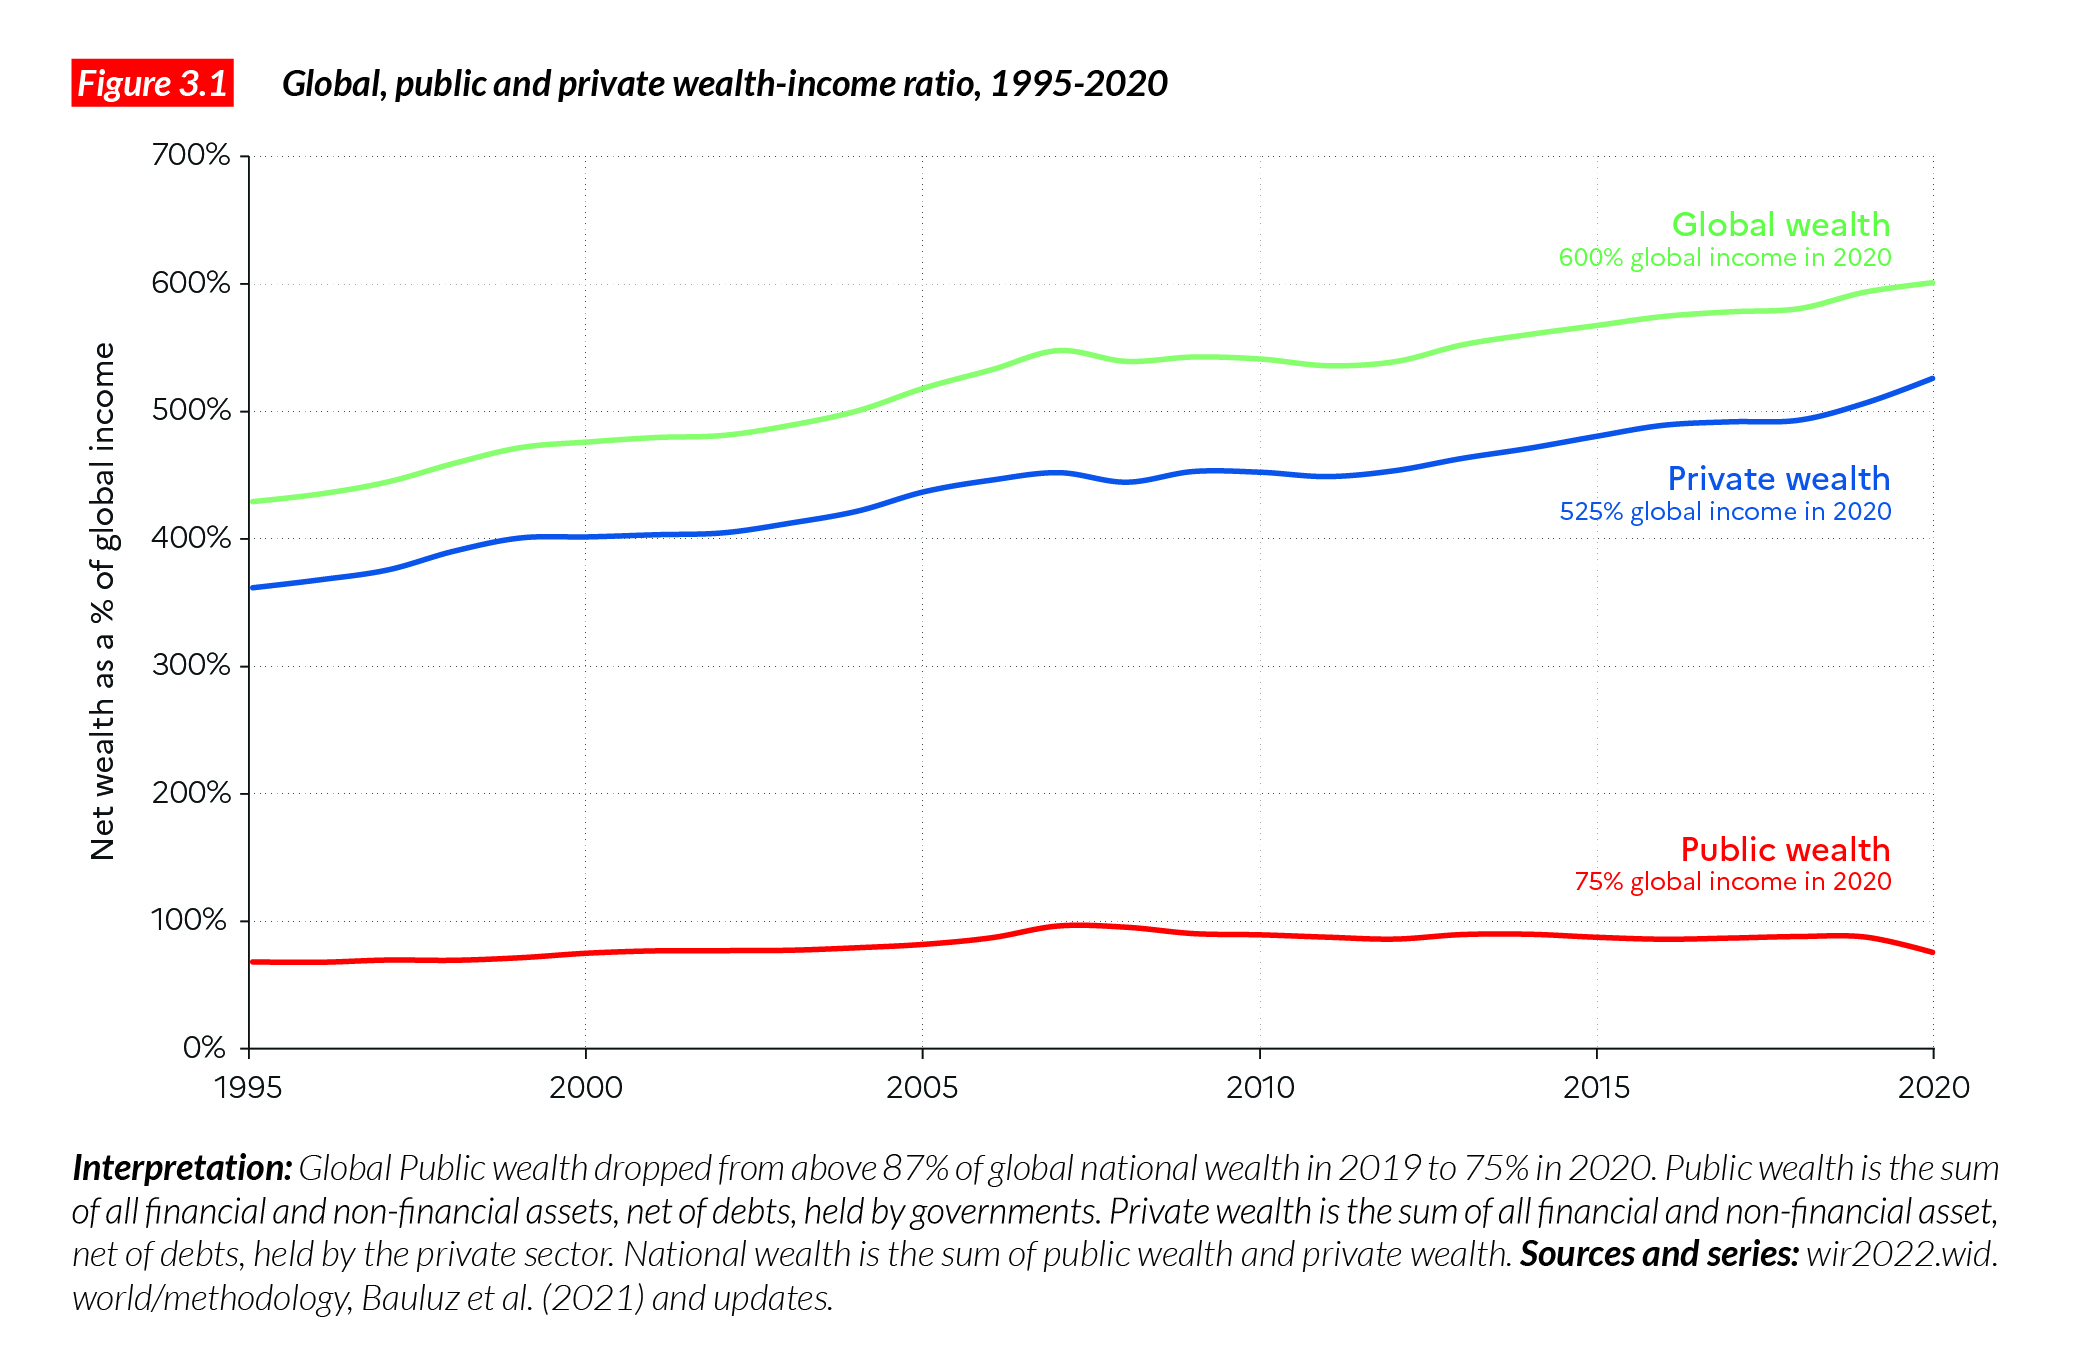
Global wealth is equal to around €510 trillion in 2020 or about 600% of national income. The ratio of total wealth to total income rose from around 450 % in the early 1990s to about 600% today (Figure 3.1). What do such values mean in practice? A wealth-to-income ratio of 450% (i.e. equivalent to 4.5 years of national income) implies that a country could decide to stop working for 4.5 years and still enjoy the same living standard as before, thanks to the sale of all its assets. After this period, the country would no longer have any assets and would have to start working again to meets its needs and to accumulate new capital. A rise from 4.5 years to six years at the global level is a very significant shift, indicating a return of the relative size of the stock of wealth vs. the flows of income in contemporary capitalism (more on historical trends below), after the drop of wealth-to- income ratios in the mid 20th century.
It is striking that this rise is almost entirely due to the increase in the global private wealth- to-income ratio. In 1995, this ratio was 360% and it rose to 510% before the Covid crisis. The trend seems to have been uninterrupted over the period. The change is notably different for the global public wealth-to- income ratio: it rose from 70% to 100% on the eve of the global financial crisis of 2008- 9, before dropping back to 90%. The private sector has become significantly richer over the past decade while governments became poorer.
The return of private wealth in rich countries
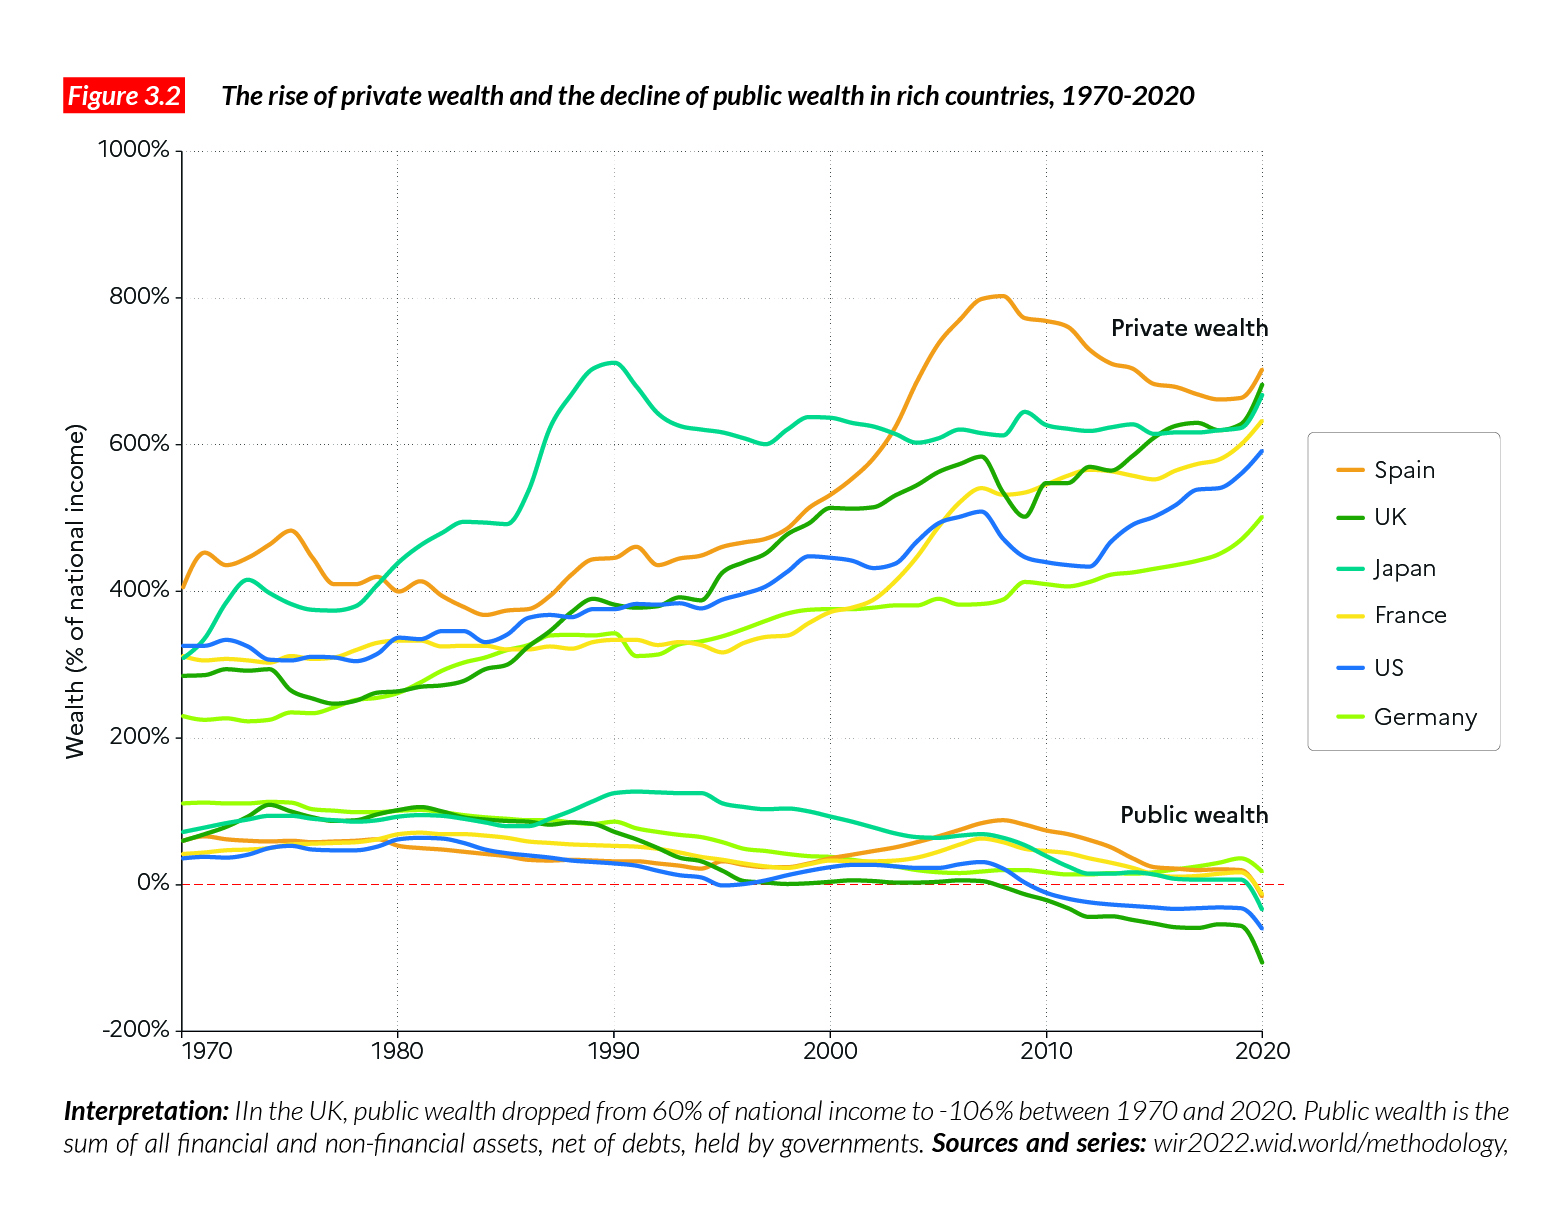
A rise in private wealth income ratios is observed in most countries, both rich and emerging, but it occurred at different rates. In high income countries, we find that in 1970, private wealth–national income ratios ranged between 200% and 400%. By 2008, when the global financial crisis began, these ratios averaged 550% in the countries observed, peaking at 800% in the extreme case of Spain (Figure 3.2). Despite the fall in these ratios in some of the countries following the financial crisis and the decline in housing prices, the multi-decade trend seems to have been largely unaltered. By 2020, in the rich countries, market value aggregate private wealth was typically twice as large as in 1970. There have been cross-country variations in volume and level among rich countries, exemplified by the extreme cases of Japan and Spain, which experienced a dramatic rise in private wealth in the 1980s and mid- 2000s. These dynamics reflect asset booms (in particular in the real estate market), which burst after the peaks in 1990 in Japan and 2008 in Spain. Remarkably, despite the asset bubble bursts, the secular trend observed in these countries seems unaltered.
Putting this trend in historical perspective, it appears that rich countries are back to (or closely approaching) the wealth to income ratios reached in the late 19th and early 20th centuries, before the political, economic and war shocks of 1914-1945. National wealth then amounted to 700% of national income in France, Germany and the UK, before dropping to around 300% after the Second World War. A series of capital control policies (rent controls, financial market regulations) helped to keep national wealth at a much lower level between the 1950s and the 1970s.
The secular fall of public wealth was exacerbated by the Covid-19 crisis
The evolution of public wealth in rich countries since 1970 has been similarly dramatic (Figure 3.2). Public wealth has fallen in all countries over the past 50 years. Indeed, in the UK and the US, national wealth consists entirely of private wealth, as net public wealth has become negative (i.e. public assets now total less than public debt) (-30% of national income). France, Japan and Germany have also experienced significant declines in public wealth, which is now worth just about 10-25% of national income according to official estimates, a tiny fraction of total national wealth. The disappearance of public wealth in national wealth represents a marked change from the situation that prevailed in the 1970s, when net public wealth was typically between 40% and 100% of national income in most developed countries (and over 100% in Germany). Today, with either small or negative net public wealth, rich countries’ governments are constrained when they want to intervene in the economy, redistribute income and mitigate growing inequality.
The impact of the Covid crisis is clear in Figure 3.2. As economies shut down, national incomes dropped by 5-10% across rich nations. Governments responded by injecting large amounts of money into the economy, to counter the epidemics, and to support workers and businesses affected by lockdowns, and running fiscal deficits close to 5-15% of national income in 2020. The value of net public wealth decreased by the same amount.
We should note that the decline in net public wealth in recent decades is mostly due to the rise of public debt (before Covid), while the ratios of public assets to national income have remained relatively stable in most countries. The relative stability of public assets – relative to national income – can be viewed as the consequence of two conflicting effects: on the one hand, a significant proportion of public assets were privatized (particularly shares in public or semi-public companies of the infrastructure, transport and telecommunication sectors, which were significant in a number of developed countries between the 1950s and the 1970s); and on the other hand, the market value of the remaining public assets – typically public buildings housing administrations, schools, universities, hospitals and other public services – increased in this period.
The rise of private wealth in emerging countries
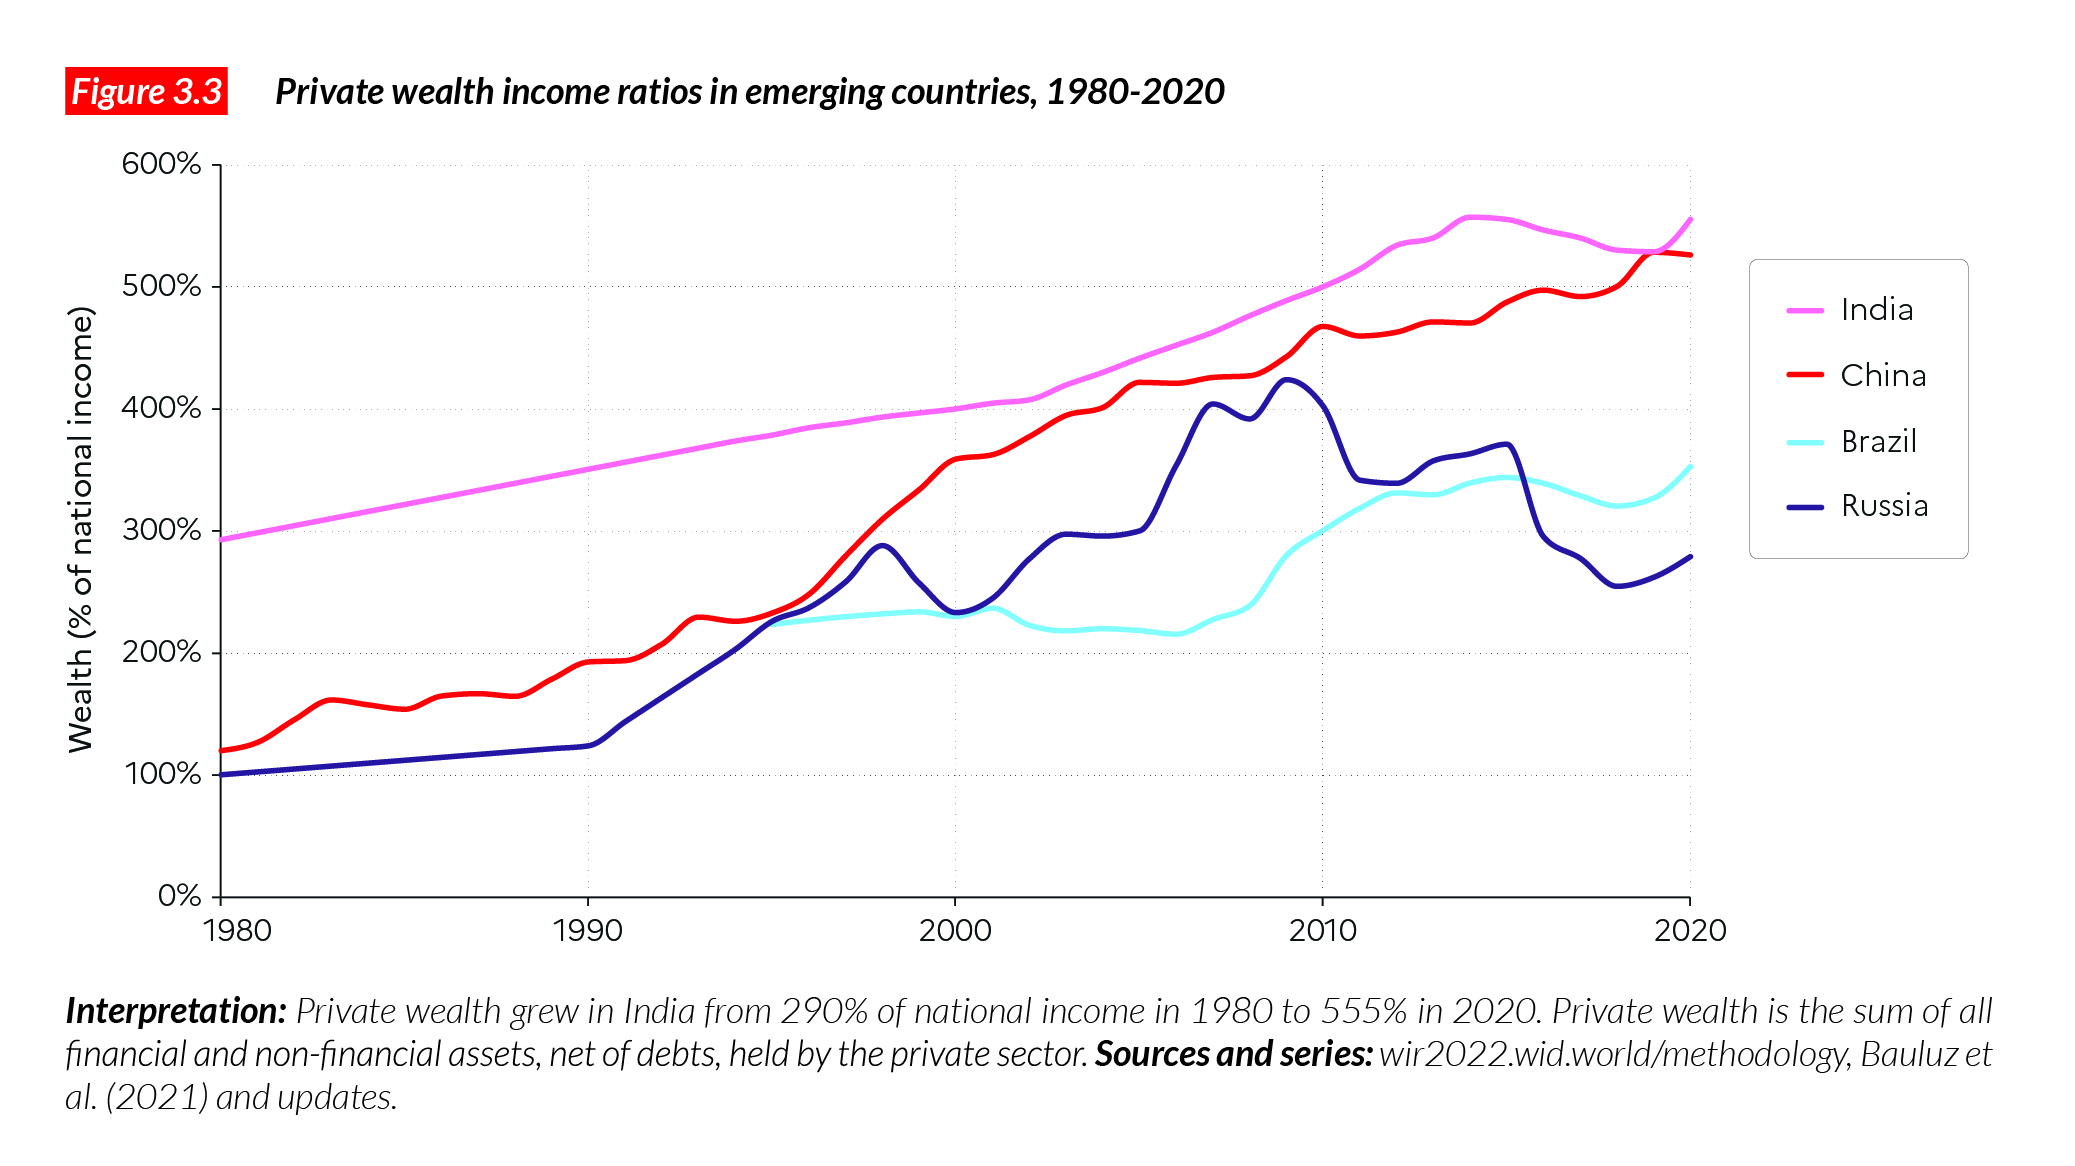
In emerging countries, the rise in private wealth has been no less spectacular than in rich countries. In fact, large emerging economies such as China and India experienced faster increases than wealthy countries after they transitioned away from communism (in China and Russia) or from a highly regulated economic system (in India). While to some extent these increases are to be expected (as a large proportion of public wealth is transferred to the private sector), the scale of the change is striking (Figure 3.3).
China has had the largest increase in private wealth in recent decades. At the time of the “opening-up” reforms in 1978, private wealth in China amounted to just over 120% of national income; by 2020, it had reached 530%. Most of this increase was due to housing (which went from 50% private ownership to near 100% in that period), and corporate ownership (from 0% privately owned in 1978 to 30% today). These increases bring the overall level of private wealth in China, relative to national income, to levels similar to those found in the US and France.
The private wealth increase seen in India over this time is also remarkable (up from 290% in 1980 to 560% in 2020). While India’s economy was highly regulated in the 1980s, and a very strong public sector controlled large segments of the economy, the private sector was significantly larger than in communist China (especially in the business sector). Today, both Asian giants have similar private wealth-to-income ratios. The speed and scale of the change in these economies surpasses that seen in industrialized countries: by way of comparison, we have to go back to the early 20th century to observe a similar magnitude of change in the wealth–income ratios in European countries (see above).
Private wealth also increased steeply in Russia following its transition to a market economy in 1990. Its private wealth-to-income ratio rose from 120% of national income to 280% today. Russia’s private wealth-to-income ratio more than tripled, from around 120% to 390% between 1990 and 2008. The transition to a capitalist regime was accompanied by an asset price bubble, which burst in the aftermath of the financial crisis. Other factors, such as the impact of Western sanctions on Russia following the Crimean war explain why Russia’s private wealth has not risen during the 2010s. All in all, private wealth in Russia today is at its level of 1998, about three times higher than its communist level. Other emerging countries, including Brazil, have experienced significant but smaller increases over these decades.
The decline of public wealth across the world
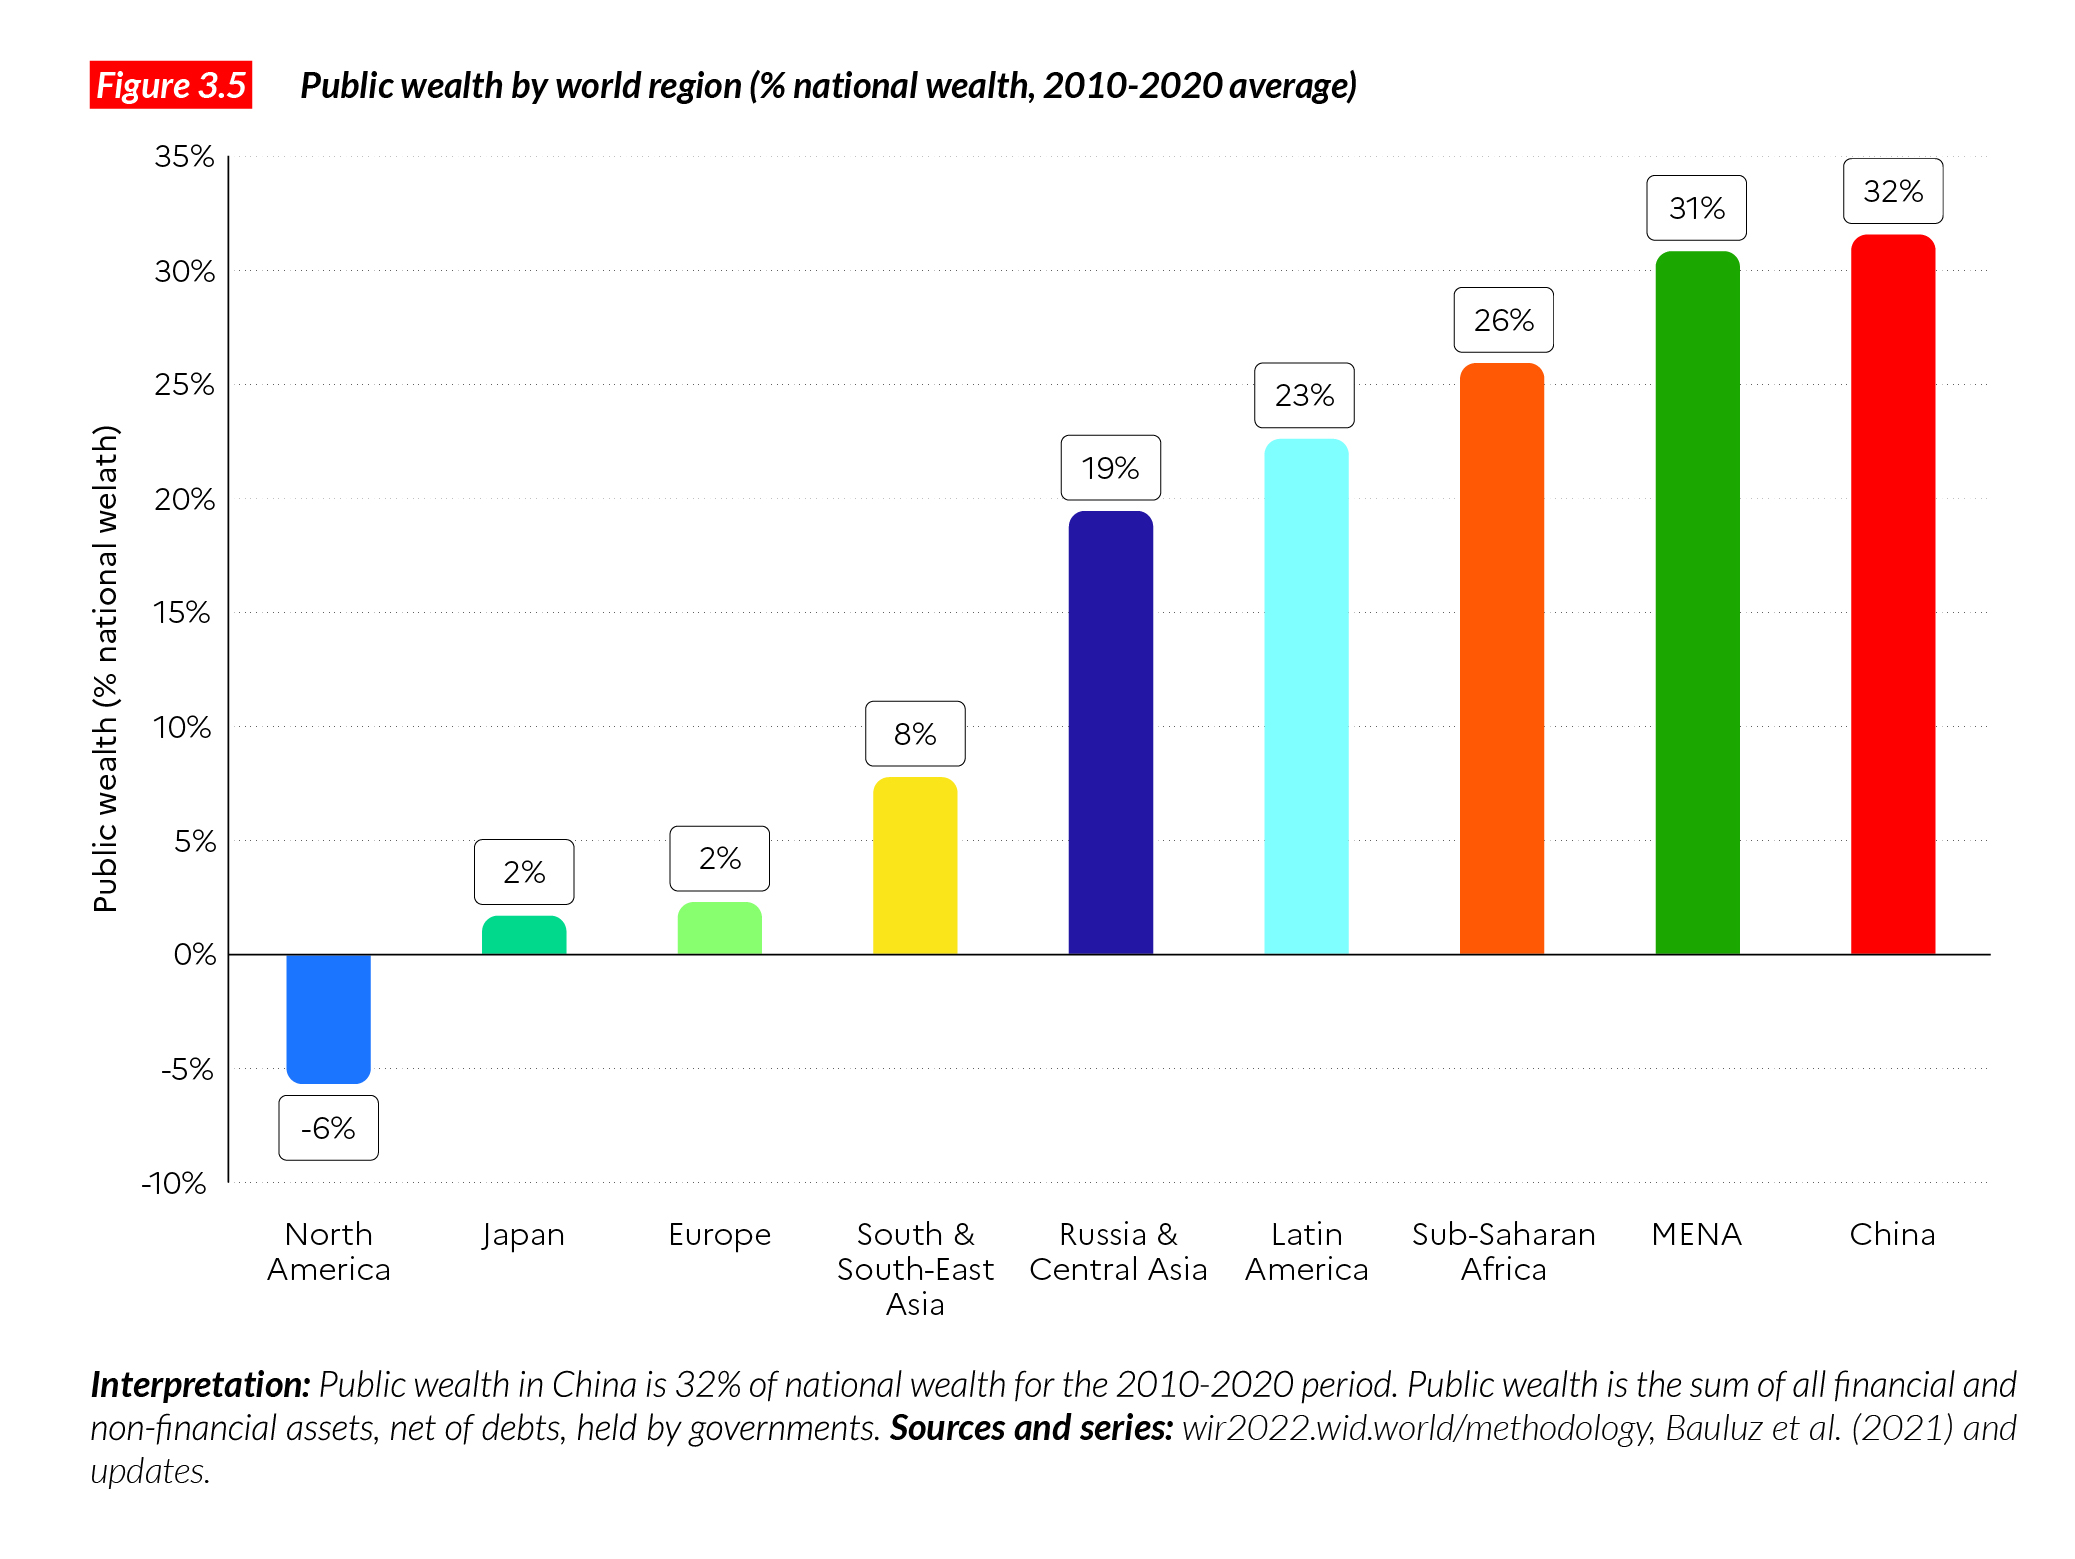
Let us focus on the secular decline in public wealth. As stated above, public wealth refers to the public ownership of infrastructure (such as school, hospitals, transport), firms and financial assets, minus public debt. Figure 3.4 expresses public wealth as a share of total wealth, meaning that if the public wealth share is equal to 30%, then the private wealth share must be equal to 70%.
In rich countries, public wealth typically amounted to 15-30% of total wealth in the early 1980s but these values have dropped to near 0% in most rich countries, and to around -10 to -20% in the US and the UK (Figure 3.4). In Western countries, zero or negative public wealth values effectively means that private actors control the whole of the economy through the assets they own. Put differently, if a Western country were to sell all its public assets to pay off its debt, then everything there is to own in that country (roads, schools, etc.) would end up in private hands. Citizens would then have to pay rents to the new private owners in order to use the privatized infrastructure (roads, schools, etc.). In the US, even this operation would not suffice to repay fully the public debt, since public wealth is currently negative. Let us also note that the higher the state debt, the greater the influence of debt holders on state budgets and tax policies. There is no clear limit to the decline of public wealth because the public sector can potentially incur an ever-increasing amount of debt.
The net public wealth position of emerging economies is markedly different. Former communist countries’ public wealth positions are now similar to those observed in rich countries in 1980, at the end of the mixed economy period (1950-1980). China’s and Russia’s public wealth currently represent 20%-30% of their total wealth, down from about 70% at the end of the communist period. Two remarks can be made at this stage: first, under communism in Russia and China, wealth was never totally publicly owned, as 20-30% of the economy belonged to private individuals then (largely in the form of housing wealth). Second, while public wealth has declined in most countries, some have been able to maintain relatively high positions. In China, for instance, the relative persistence of public wealth is the result of strategic efforts to maintain control of economic assets, in particular in the business and infrastructure sectors. These have been coupled with a strict control of foreign private investments in the economy since 1978.
There are examples of high public wealth persisting in rich countries as well. In the Czech Republic for instance, the share of public wealth in national wealth has decreased from 70% to 30%, staying significantly above the levels observed in larger Western European countries. This case demonstrates that maintaining relatively high public wealth levels is not incompatible with Western political systems.
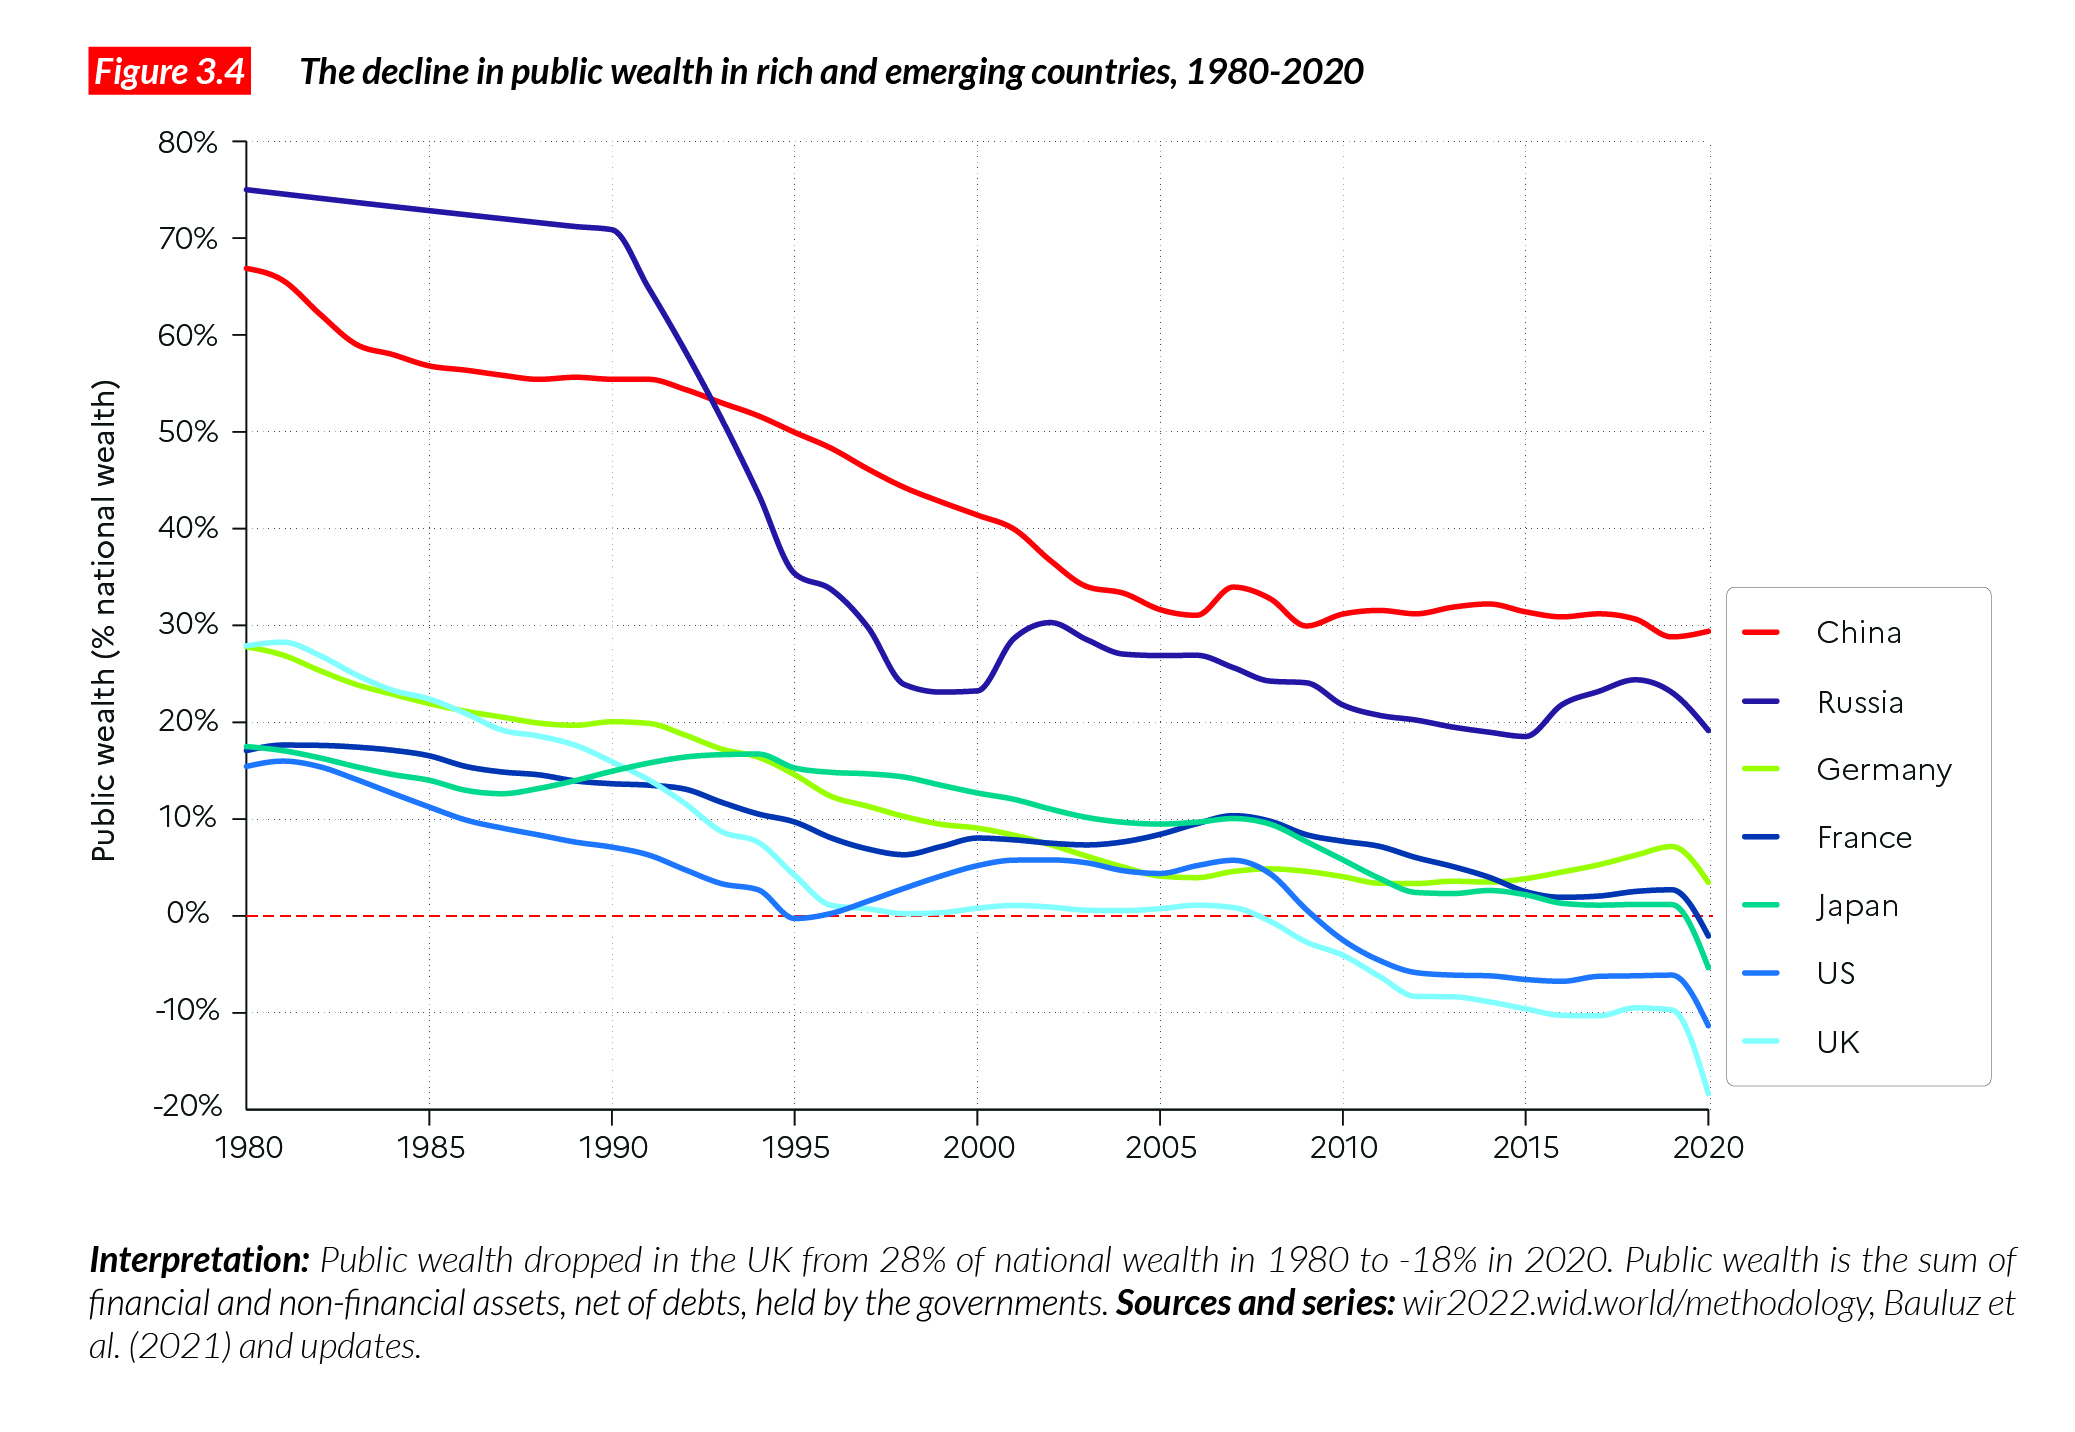
Another, extreme, counter-example to the decline of public wealth among Western countries is Norway. There, public wealth rose from around 100% of national income in the 1990s to nearly 500% of national income today. This growth followed the discovery of fossil fuel reserves, and the subsequent transformation of profits generated by oil and gas extraction into permanent public wealth, through investments made by the Norwegian sovereign wealth fund in financial markets all over the world. Obviously, this model of public wealth creation is singular, as most countries do not have large oil and gas resources. The Norwegian strategy also raises serious concerns from an environmental point of view, as most fossil fuel resources should be kept underground if we are to meet the objectives of the Paris Agreement on climate change.
That said, Norway’s strategy should be considered from an international perspective. Russia has also been exporting fossil resources over the past decades but pursued a very different strategy than Norway, privatizing its resources at low cost to the private sector, with little gain for the public sector. The UK, which also discovered offshore gas in the 1970s, pursued a different strategy too. The UK did not reinvest the revenues in a large sovereign fund as Norway did. In sum, maintaining relatively high public wealth, whether in China, the Czech Republic or Norway, is always a matter of political choice.
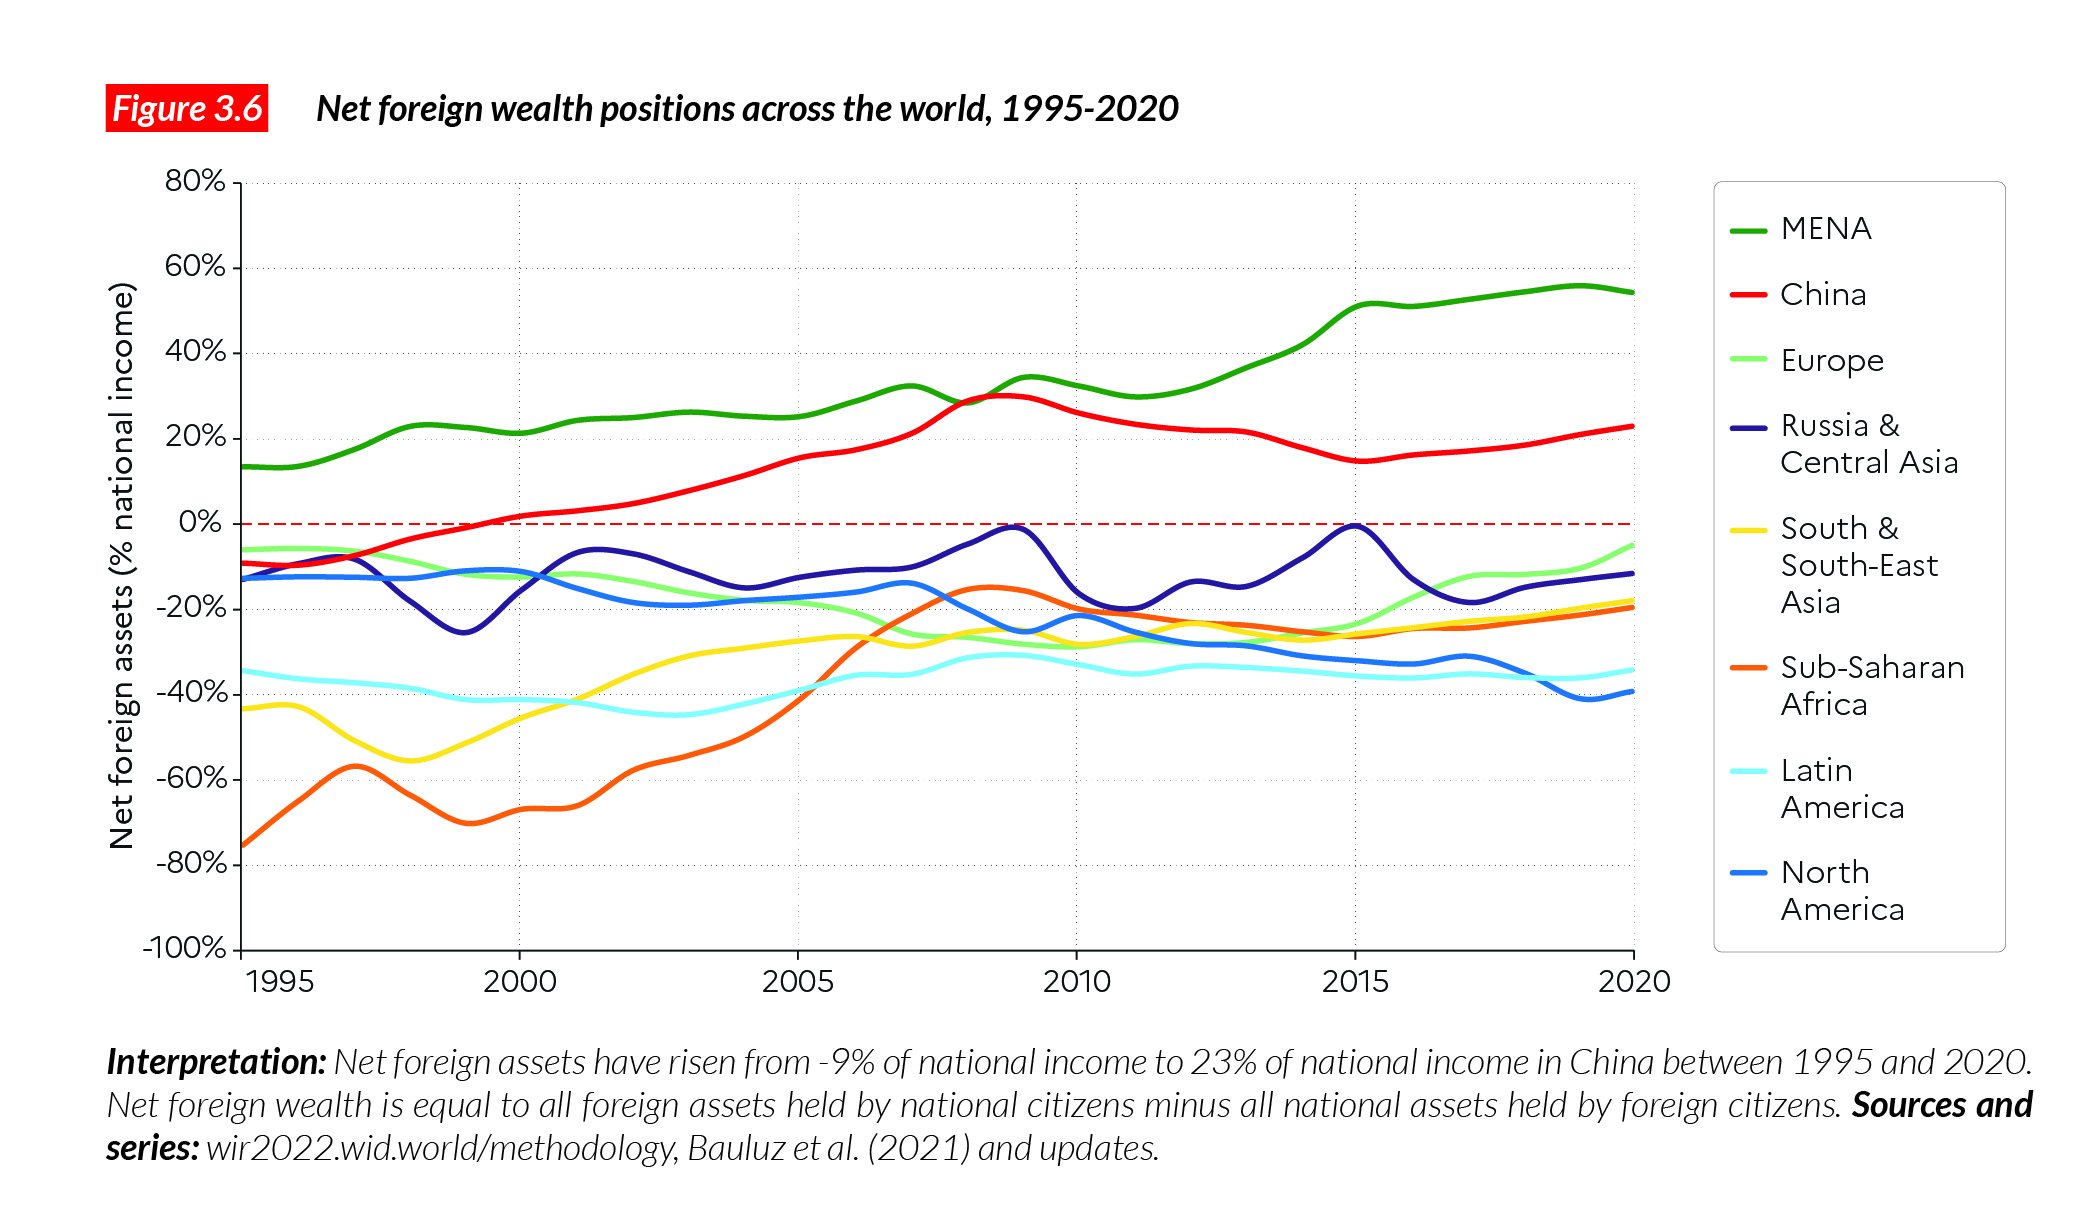
Net foreign wealth has largely increased in East Asia and fallen in North America
Wealth held by private and public actors can be domestic or foreign. The net foreign wealth positions of countries indicate whether the citizens and state of a country own more assets in foreign countries than foreign countries own assets in that country. In the US, net foreign wealth has been declining over the past decades, meaning that US assets possessed by foreigners now total more than all the US assets abroad. This gap has increased significantly since the 2010s. Today, net foreign wealth represents about -40 to -50% in the US, meaning that the overall value of US assets owned by the rest of the world is worth significantly more (i.e. the equivalent of 50% of national income) than the value of assets owned by Americans in other countries.
Conversely, net foreign assets significantly increased in China between the 1980s and 2000s, and have been maintained at a high level since then (about 20%-25% of national income). What is striking though, is that net foreign income positions (i.e. the income generated by foreign assets) remain positive in the US and negative in China: assets owned by Americans in other countries are more profitable than assets owned by Chinese abroad – at least until now. This illustrates the power of the dollar in the international legal and monetary systems, which to some extent allows the US to accumulate large foreign deficits at limited cost. Interestingly, the net foreign wealth position of Europe deteriorated between the mid-1990s and 2010, before returning to equilibrium.
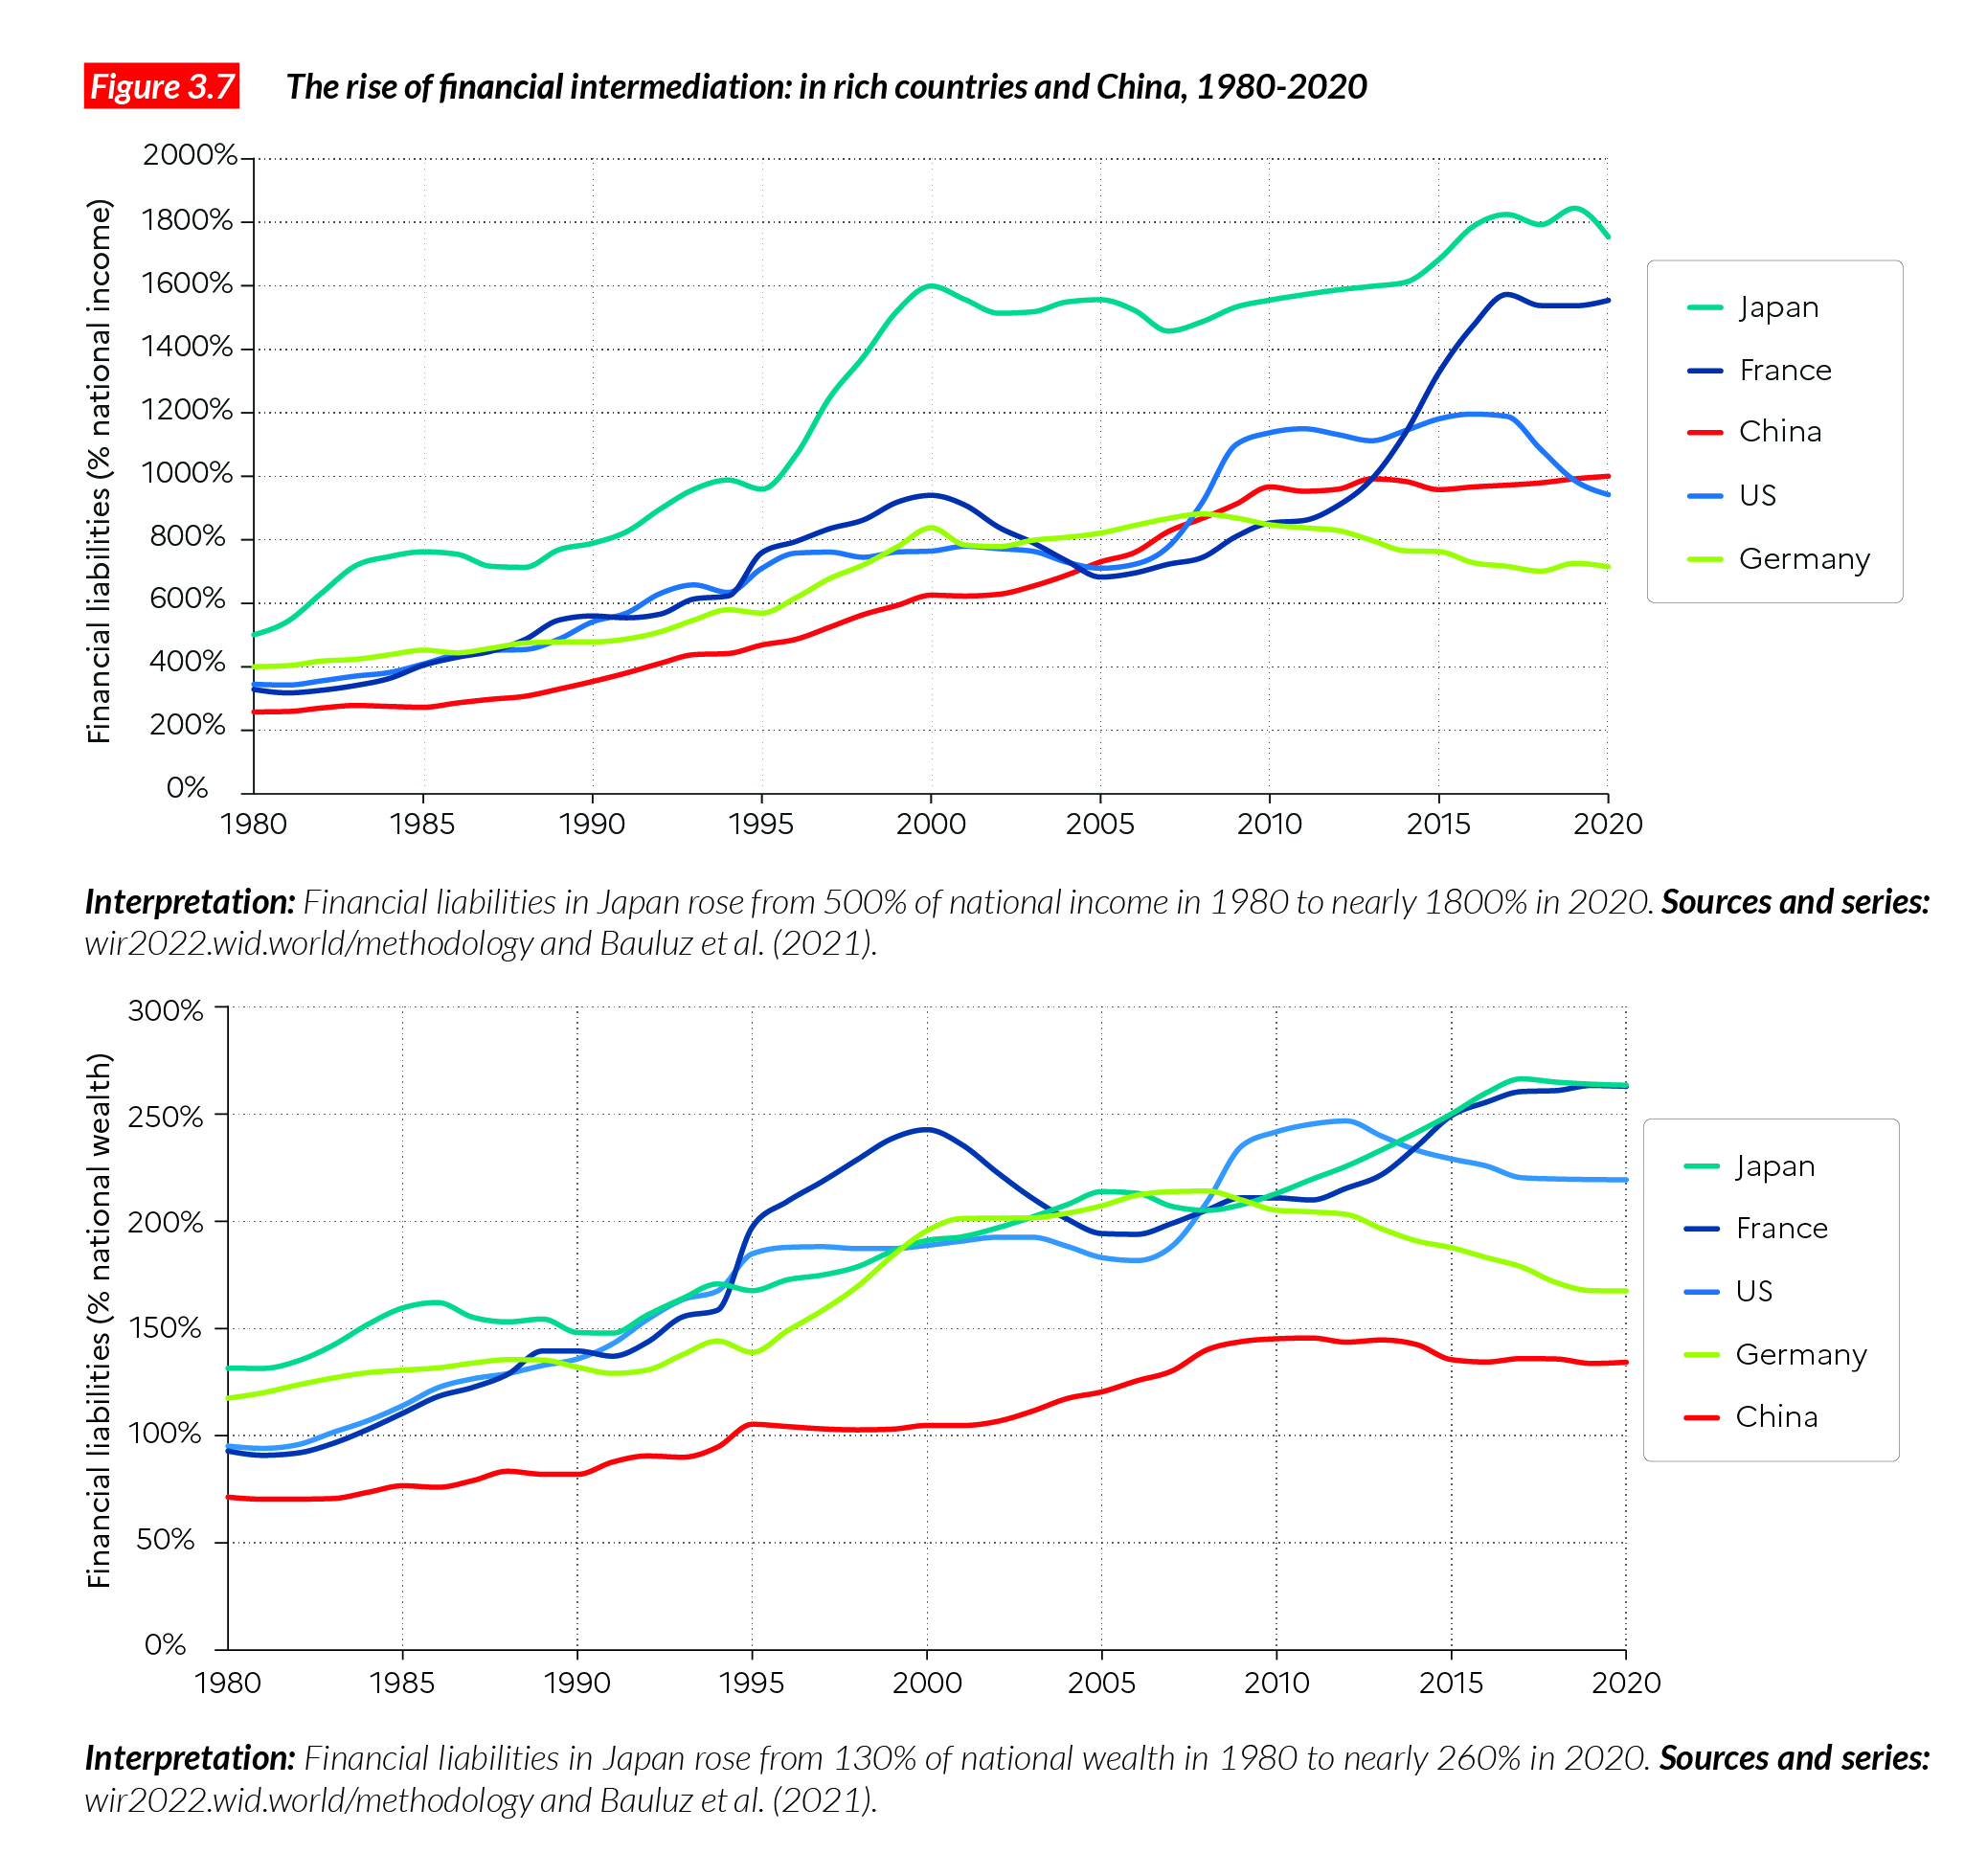
Financialization increased everywhere since 1980, but at different speeds
In principle, financial markets and intermediation are supposed to help to allocate capital where it is needed and therefore help to boost national incomes across the world. Financialization has played a key role in the rise of private capital across the world over the past decades. How do we measure the weight of finance in contemporary capitalistic economies?
One way is to look at the ratio between total financial liabilities – i.e., total debt and equity issued by households, the government, and the corporate sector combined – and national income. In China and in rich countries, this ratio has risen from 250%-500% in 1980, to 700-1800% in 2020 (Figure 3.7). In practice, the financialization of contemporary economies can have dire consequences because it makes them more vulnerable to financial crises, which in turn can become worldwide because of financial integration (e.g., the 2008-9 financial crisis started with subprime mortgages in the US and then spread). Financial intermediation also tends to disconnect investment decisions on the allocation and use of capital from where economic activity actually takes place (more on this below). Investors in Singapore who decide to invest in the US inevitably pursue different motives than workers and capital owners living in the US. Financial intermediation thus raises important governance and regulation issues.
While financialization has greatly increased in countries like France and Japan over the past few decades, some countries have somewhat resisted the rising trend. In Germany, the ratio of financial liabilities to national income rose from 400% in 1980 to 800% in 2005 before dropping back to 700%, revealing that financialization has little to do with overall economic performance.
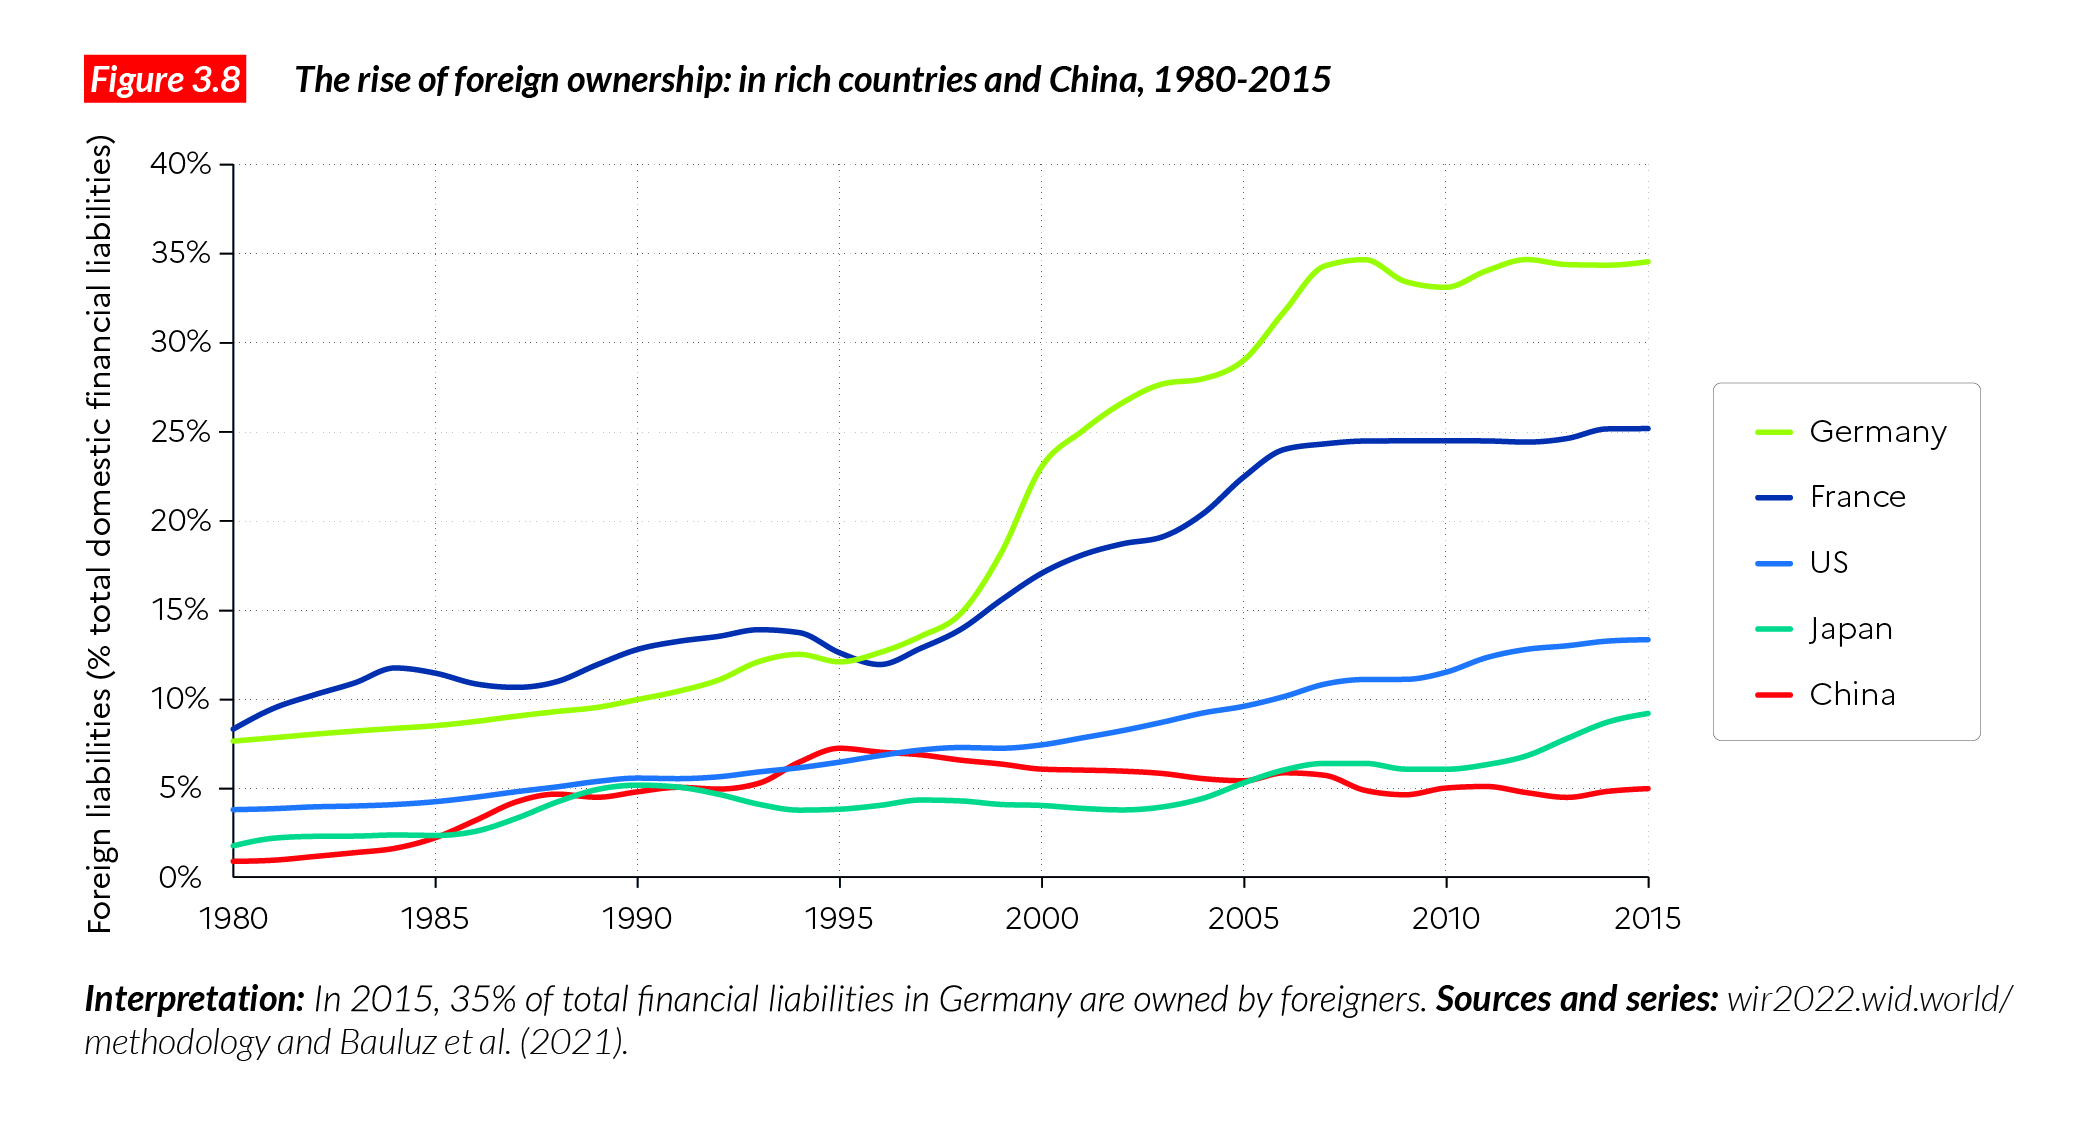
Economies are increasingly owned by foreigners but some have resisted this trend more than others
With the rise of financialization, financial wealth is also increasingly owned by foreigners. One way to measure this phenomenon is to focus on the ratio of foreign financial liabilities to domestic financial liabilities. France and Germany (and European countries in general) have relatively large foreign ownership levels: foreign liabilities represent 25-30% of domestic financial liabilities in these countries, up from less than 10% in the early 1980s, and having increased especially in the 2000s.
Foreign financial liabilities have also increased in the US, but at 17% remain markedly lower than in Europe today. China and Japan show a different profile. Their foreign financial liabilities represent 5% (China) and 10% (Japan) of domestic financial liabilities. The East Asian economic giants are significantly less open to foreign financial ownership than the West (Figure 3.8). The dynamics observed in China are interesting. Between 1978 and the mid-1990s, foreign financial ownership increased rapidly in China, until it caught up with the US. After the mid-1990s, their trajectories diverged, as China strictly controlled foreign financial flows into the country.
The strong differences between European countries and others are partly the effects of size: European countries are smaller than the US, Japan and China, and if ownership were to be consolidated at the European level, then the rest of the world would own only about 15-20% of European wealth (so, like the levels in the United States). Even so, it appears to be true that some Asian countries – Japan, and particularly China – are less open to foreign ownership than European and North American countries. At this stage, it is too early to say whether the recent announcements made by US and European Union administrations aimed at curbing foreign ownership (in particular by China), will significantly alter foreign asset ownership positions in these countries.
Box 3.1 How do we measure wealth inequality within countries?
While the measurement of national wealth is a centuries’ old tradition as monarchs were interested in evaluating wealth in their kingdoms for tax purposes, it is only recently that governments have started systematically to measure and publish aggregate wealth data called balance sheets. In many countries (in particular emerging and poor nations), such basic information is still missing today. Below, we briefly sketch the general method used to measure wealth across countries.
We begin with the set of concepts and guidelines of the System of National Accounts, which distinguishes between six institutional sectors that can own wealth, five resident sectors, and the foreign sector. The five resident sectors are households, non- profit institutions serving households, non- financial corporations, financial corporations, and the general government. We re-group these five sectors into three: (i) the private sector (the sum of households and non- profit institutions serving households), (ii) the corporate sector (financial plus non- financial corporations), and (iii) the general government.
Wealth can be broken down into four classes of assets and liabilities: housing assets, business and other non-financial assets, financial assets, and liabilities. Housing assets are defined as the sum of the market value of dwellings and land beneath dwellings: in practice, it is generally easier to measure the sum (as observed in real estate transactions) than the two components separately.
Business assets (and other non-financial assets) are the difference between total non- financial assets and housing. Financial assets regroup for instance currency, deposits as well as bonds and loans, equity, life insurance or pensions funds. For all sectors, we report total liabilities, except for corporations, where we distinguish between equity and non-equity liabilities.
In order to measure total national wealth in each country of the world, we first collect and harmonize the available information on each of the classes of assets described above. In the past few years, there have been improvements in the publication of aggregate wealth data. Using empirical regularities observed in countries where all asset classes are available, we estimate asset class data in countries (typically, low- income ones) where some items are missing. The resulting database is the most extensive set of data on aggregate wealth across the world6.
1 The national accounts provide a measure of the capital stock reflecting only past savings poured into the capital stock, net of the depreciation of capital, and adjusted for general price inflation. This measure does not take into account changes in asset prices (such as increases in real estate prices or stock prices). In contrast, the measure of household wealth at market value published in the financial accounts captures such price effects.
2 Whenever possible, it is preferable to study nonprofit institutions separately, and to distinguish between foundations serving private interests and those serving the general interest. Unfortunately, this line can sometimes be difficult to draw, and in practice the wealth of non-profit institutions is often mixed up with household wealth in existing national accounts. The share of nonprofit wealth in total private wealth is always less than 10% (and usually less than 5%). See Piketty T. and G. Zucman. 2014. “Capital is Back: Wealth-Income Ratios in Rich Countries 1700-2010”, Quarterly Journal of Economics. 1255–1310. doi:10.1093/qje/qju018.
3 In practice, national accounting distinguishes between two definitions of national wealth. Market value national wealth, and book value national wealth. Market value national wealth is the sum of the net wealth possessed by governments and the private sector in a given country. Book value national wealth is equal to national wealth plus the net wealth of the corporate sector when there is a difference between the market value of firms and the book value of these firms (i.e. a difference between the value of all the assets they possess and how markets evaluate this value). The standard concept used throughout this report to track wealth is “market value national wealth” (which we refer to as national wealth). At times, we explicitly refer to book value national wealth to make comparisons (see Box 4.1).
4 Piketty, T.. 2020. Capital and ideology, Cambridge: Harvard University Press.
5 See also Piketty and Zucman. “Capital is Back”.
6 For more information, see Blanchet T., L. Bauluz, A. Sodano and C. Martinez-Toledano. 2021. “Estimation of Global Wealth Aggregates in WID.world: Methodology”. World Inequality Lab working paper.
