The regional composition of the global income distribution, 1820-2020
“Contemporary global inequalities are close to their early 20th century level, at the peak of Western imperialism”
While inequality has increased within most countries of the world, Over the past two decades, global inequalities between countries have declined. The gap between the average incomes of the richest 10% of countries and the poorest 50% of countries dropped from around 50 to a little less than 40. At the same time, inequalities increased significantly within countries. The gap between the average incomes of the top 10% and the bottom 50% within countries has almost doubled, from 8.5 to 15. This strong rise of inequalities within countries has meant that, despite economic catch-up and strong growth in the emerging world, the world remains particularly unequal to today. It has also meant that inequalities within countries are now even larger than the strong inequalities that are observed between countries.
From a historical perspective, it appears that global inequalities are about as large today as at the peak of Western Imperialism in the early 20th century. Indeed, the share of income captured by the poorest half of the world population is about 2 times lower today than in 1820, before the great divergence between Western countries and their colonies. In other words, there is still a long way to go to exit global economic inequalities inherited from the very unequal organization of world production of the mid-19th-mid 20th century.
This chapter is based on L. Chancel and T. Piketty. 2021. “Global inequality 1820-2020: The Persistence and Mutation of Extreme Inequality”, Journal of the European Economic Association.
In Chapter 1 we provided a snapshot of current global inequality levels. In this chapter, we turn to global inequality trends. For this, we use a historical perspective to understand how current levels of inequality compare with those observed in earlier times. Looking at the past (whether a few decades back or a century ago), is critical to understanding the present. Historical perspectives on inequality make it possible to discuss questions such as: have there been lower inequality levels than now and how did societies deal with them? How extreme could inequalities be in the future?
Let us be clear: comparing inequality levels from one century to the next requires caution. A given level of global inequality can mask very different realities, between say, the European-dominated world economic order of 1910 and contemporary multi-polar capitalism (more on this below). It is not only the very notions of income and wealth that differ across times and cultures, but also forms of economic and political power. That said, some basic characteristics of human societies can be compared over time. Economic resources owned by individuals are not infinite and have to be shared, more or less equally. Constructing indicators to understand how this distribution of economic resources has evolved over time improves our collective understanding of the roots of justice and injustice across societies.
Global inequality rose between 1820 and 1910, and stabilized at a high level since then
Using similar inequality indicators as in Chapter 1, we start here with the basic breakdown of the shares of world income going to the global top 10%, middle 40% and bottom 50% groups between 1820 and 2020 (see Figure 2.1). The first striking finding is that the level of global income inequality has always been great. The global top 10% income share oscillated around 50-60% of total income between 1820 and 2020, while the bottom 50% share has generally remained around 5-15%. This corresponds approximately to the level of inequality that we currently observe in the most unequal countries in the world, such as South Africa, Brazil, Mexico and the United Arab Emirates (see Chapter 1). In brief: in terms of inequality and concentration of resources and economic power, the world today is and has long been like a giant South Africa.
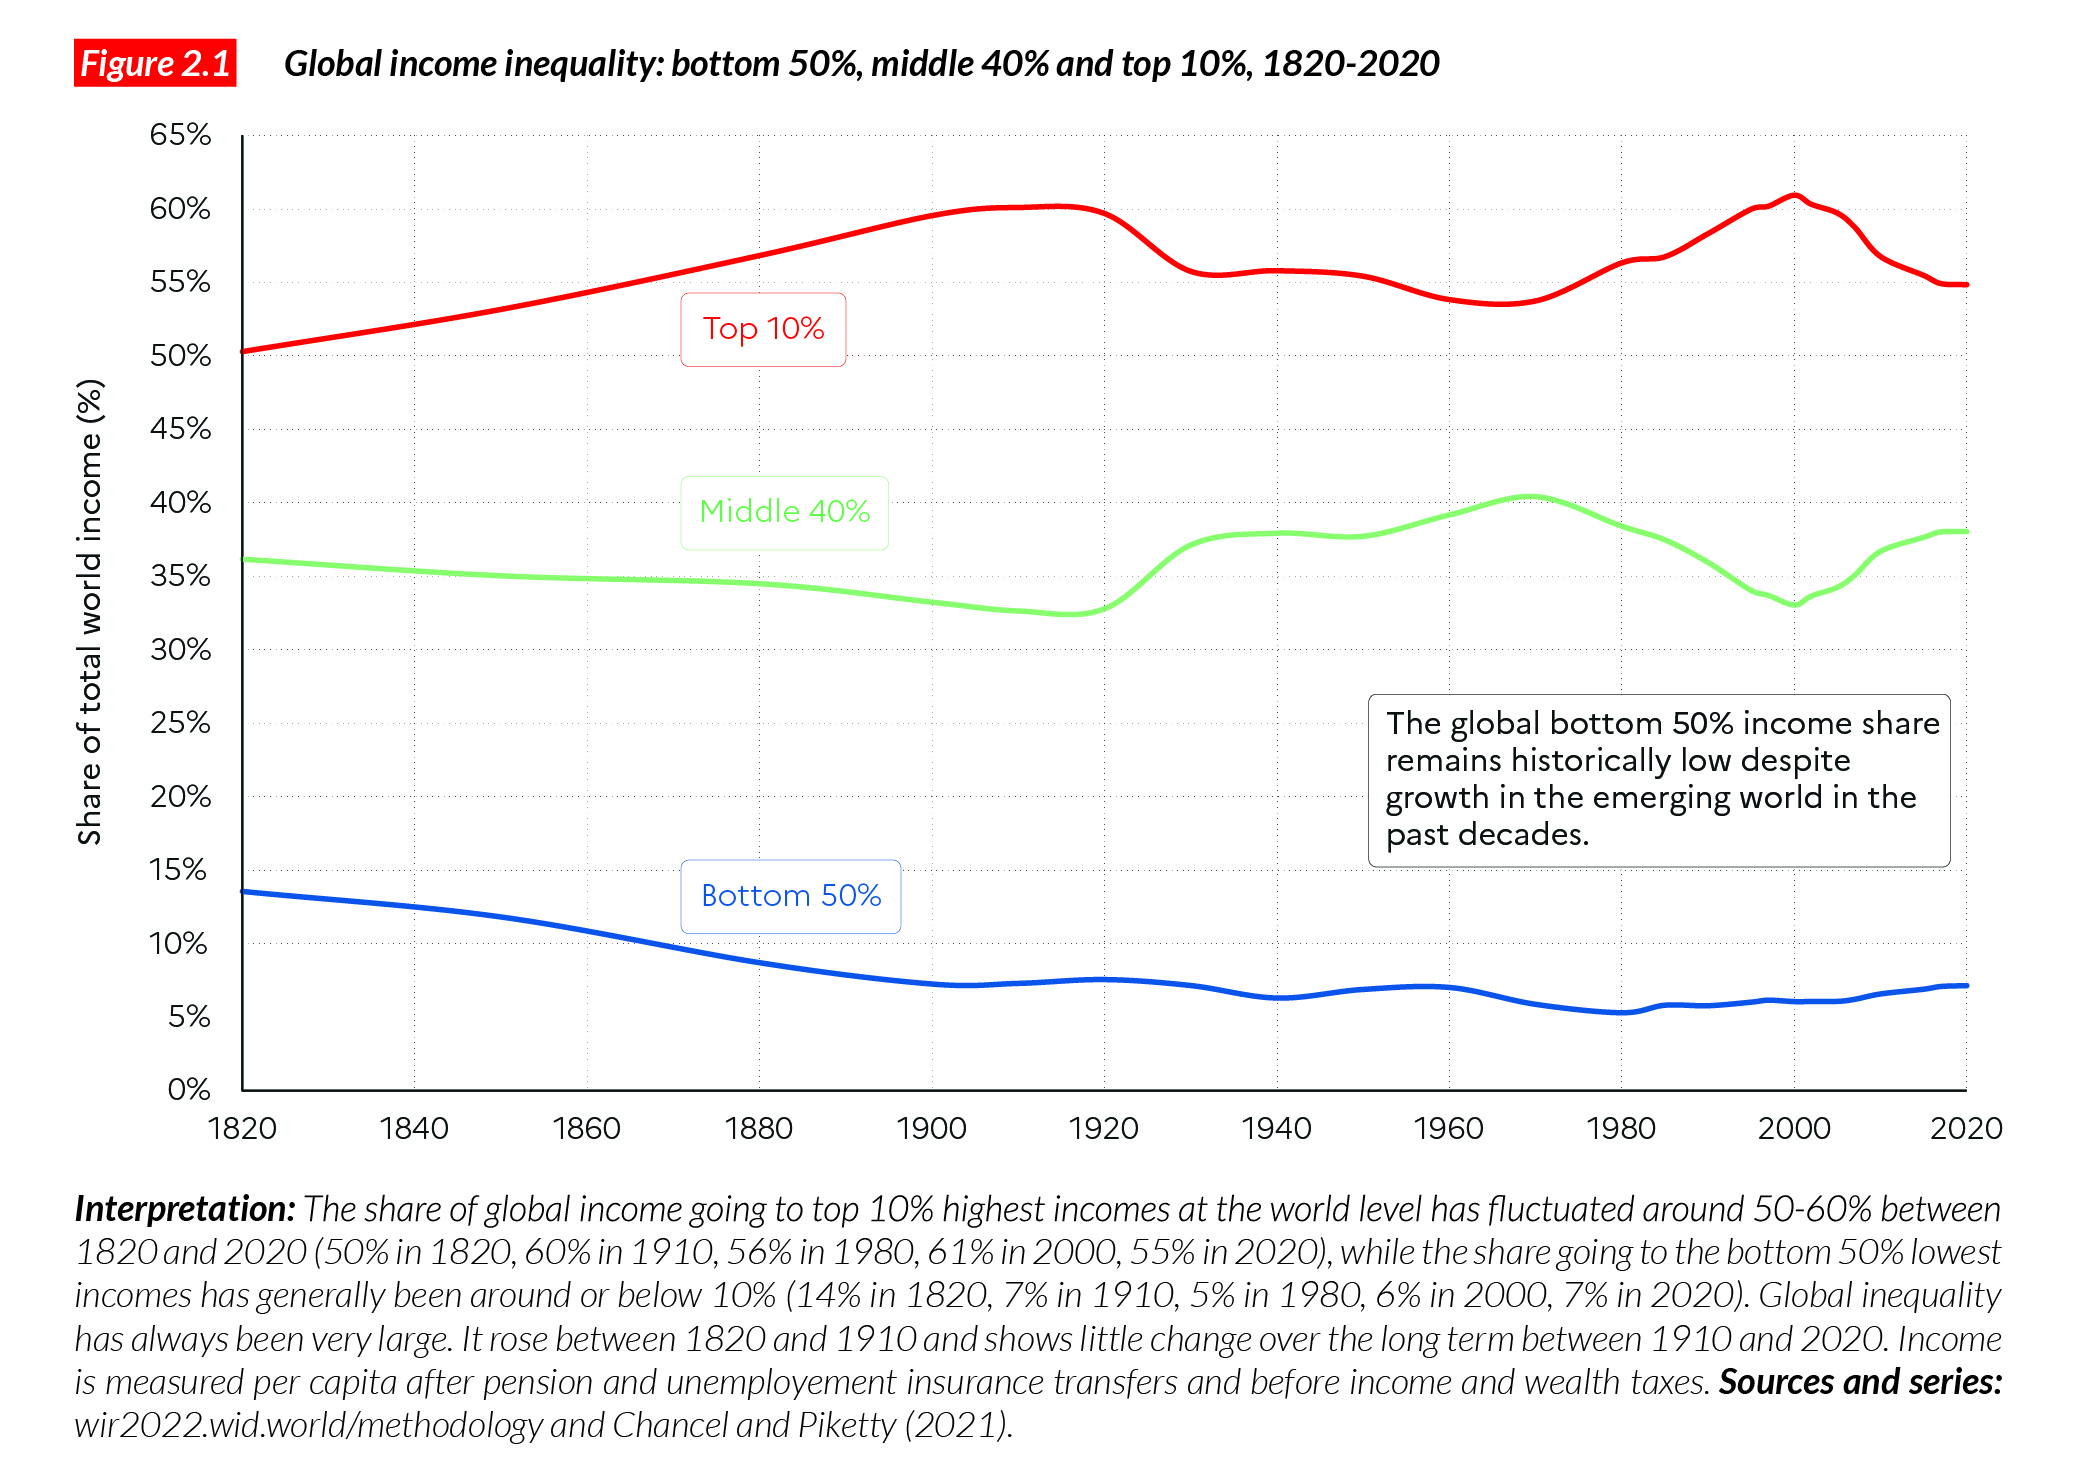
We can also see in Figure 2.1 a clear rise in global inequality between 1820 and 1910. The top 10% share rose from 50% to 60%, while the bottom 50% share dropped from 14% to 7%. In contrast, the shift observed between 1910 and 2020 involves a number of contradictory changes and compensating trends. The bottom 50% share further dropped from 7% in 1910 to 5% in 1980, before rising to 7% in 2020, so that it is today very close to what it was in 19101. The top 10% share dropped from 60% in 1910 to 54% in 1970, before rising back to 61% by 2000, and declining again to 55% in 2020. If we look at the overall change between 1910 and 2020, there is no clear long-run trend in inequality, either downward or upward, except maybe a small improvement in the share of the global middle 40%.
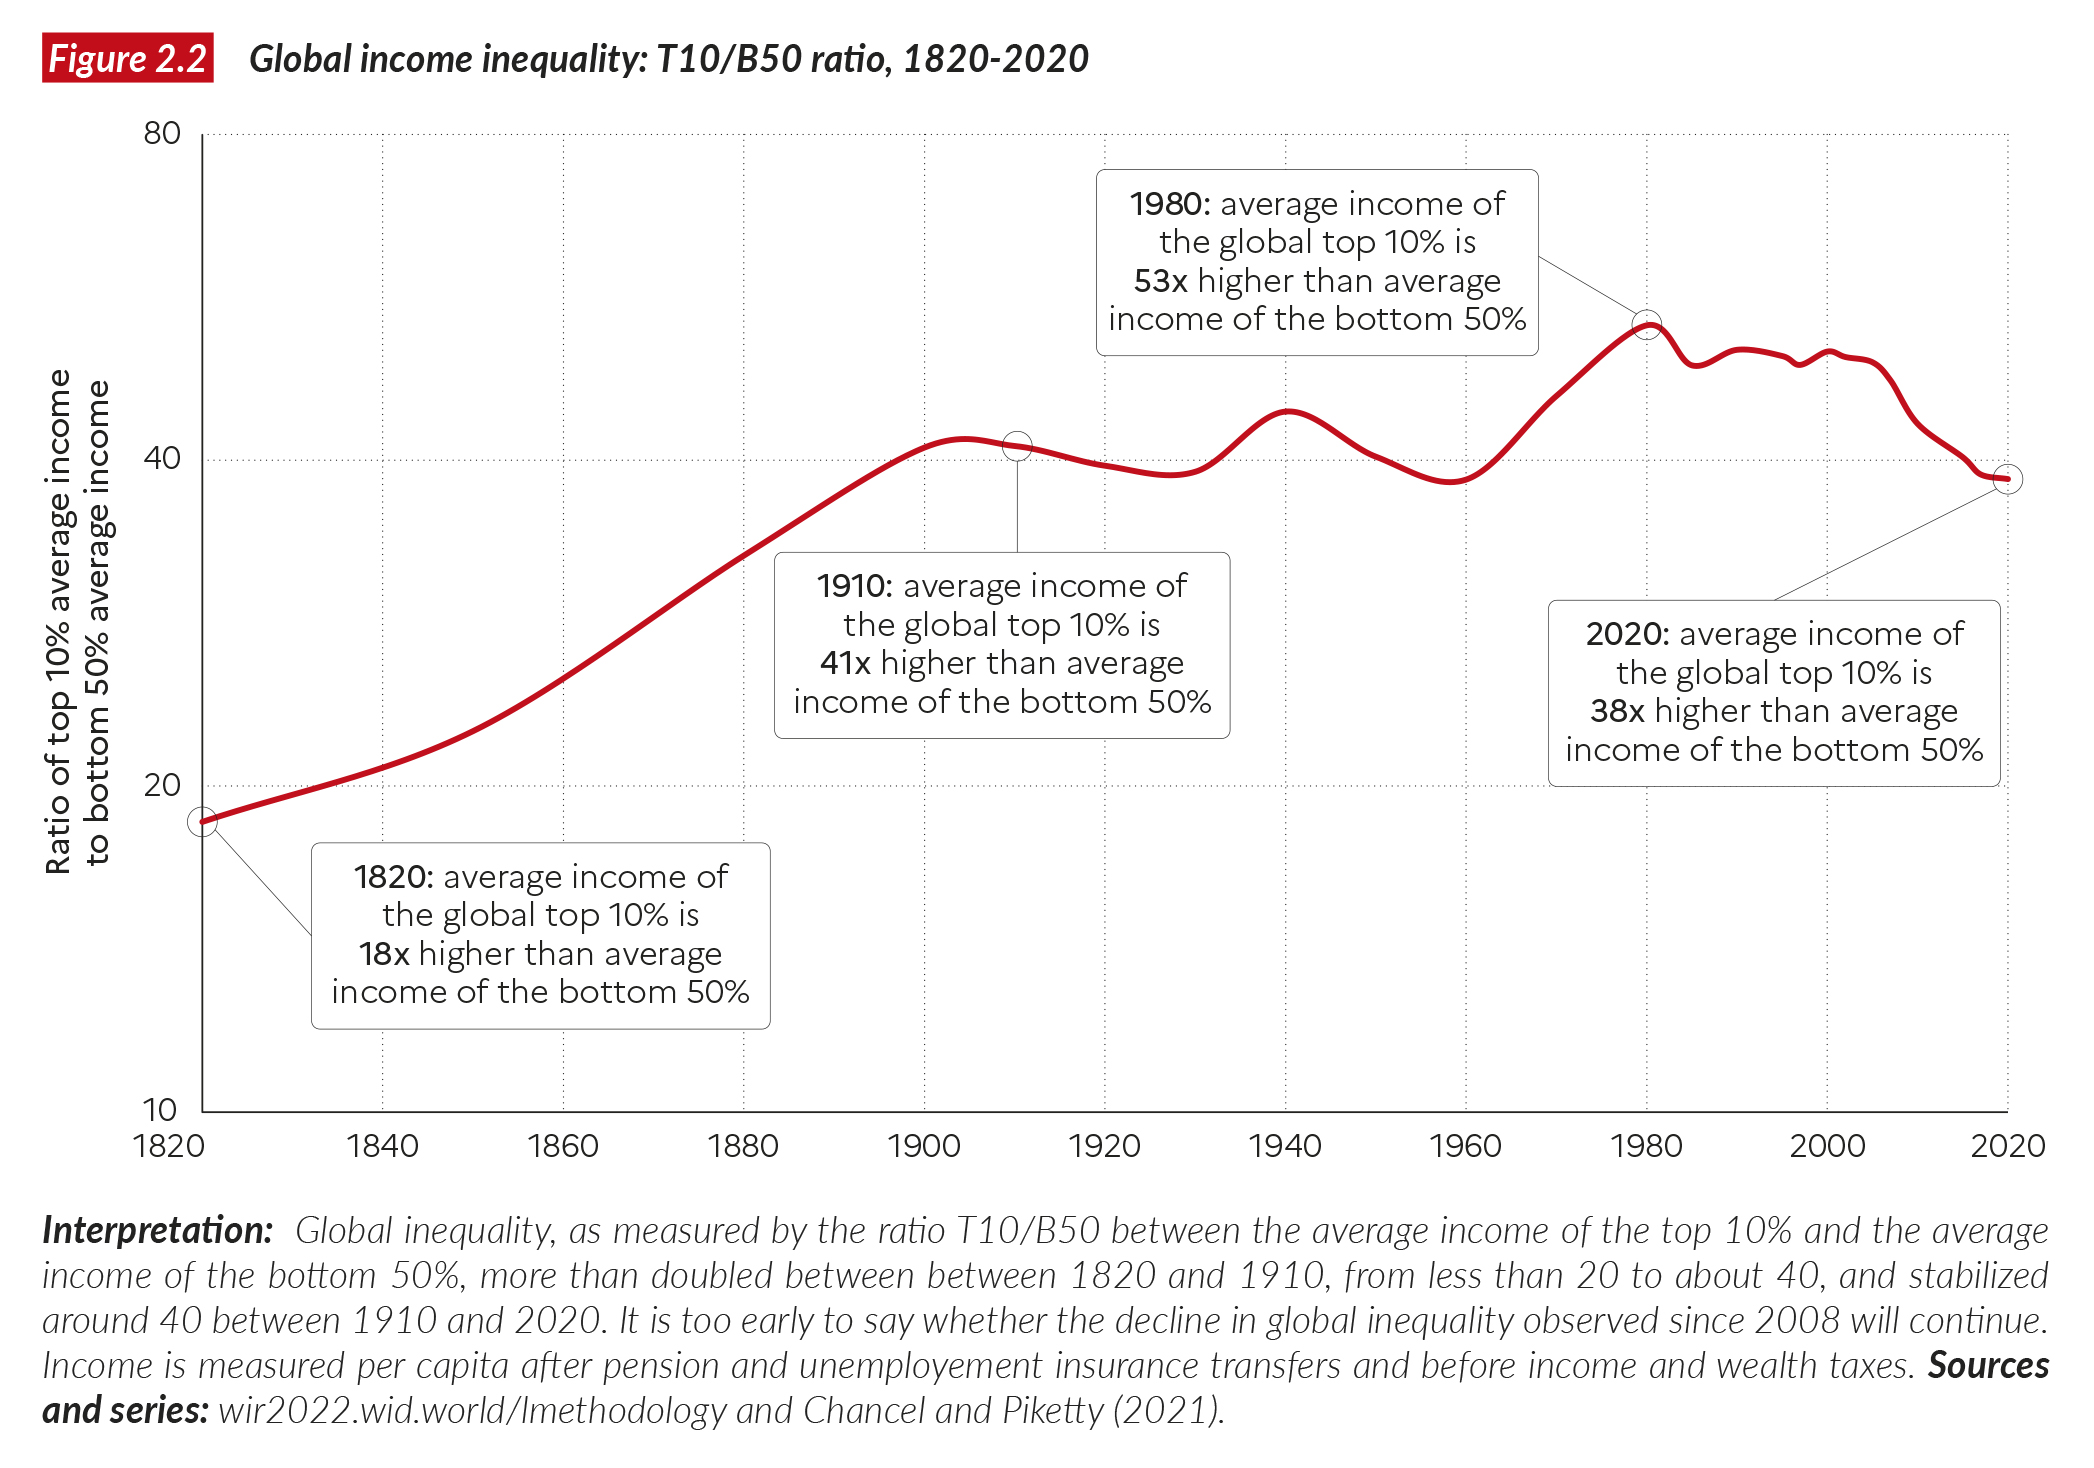
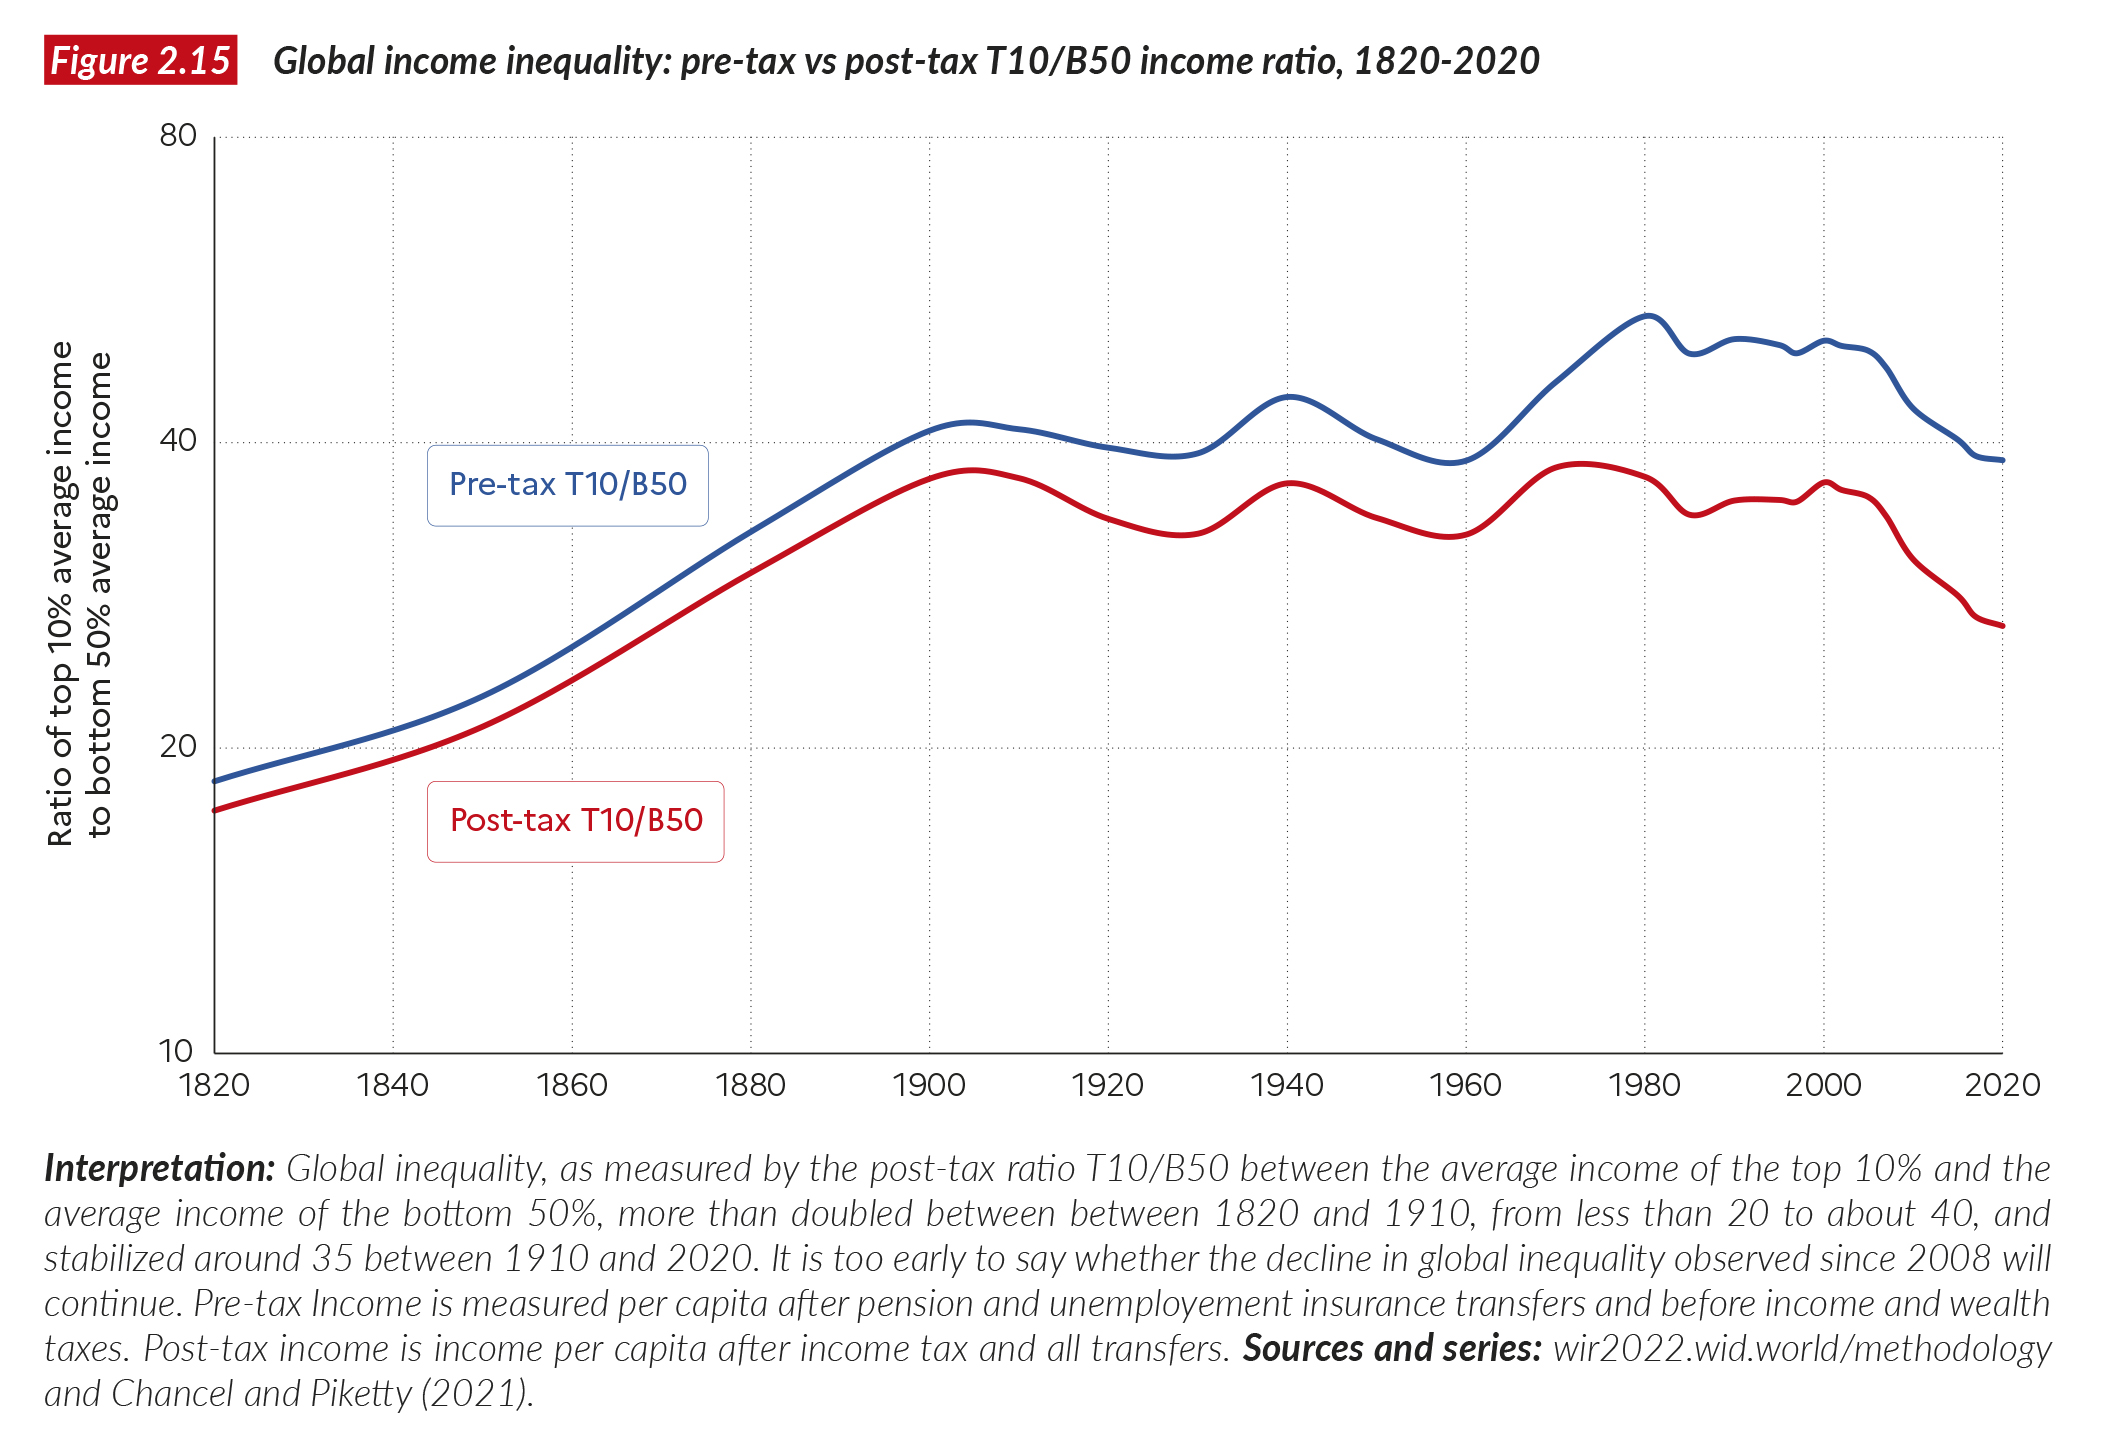
We reach the same conclusion if we look at global inequality indicators such as the top 10/bottom 50 (T10/B50) income gap between the average incomes of the top 10% and the bottom 50%. The global T10/B50 income gap more than doubled between 1820 and 1910, from 18 in 1820 to 41 in 1910 (see Figure 2.2). It reached an all-time high of 53 in 1980 and 50 in 2000, before declining to 38 in 2020. It is striking that the decline in the global T10/ B50 income gap occurred for the most part after the 2008 financial crisis. It is too early to say whether that decline will continue in the future.
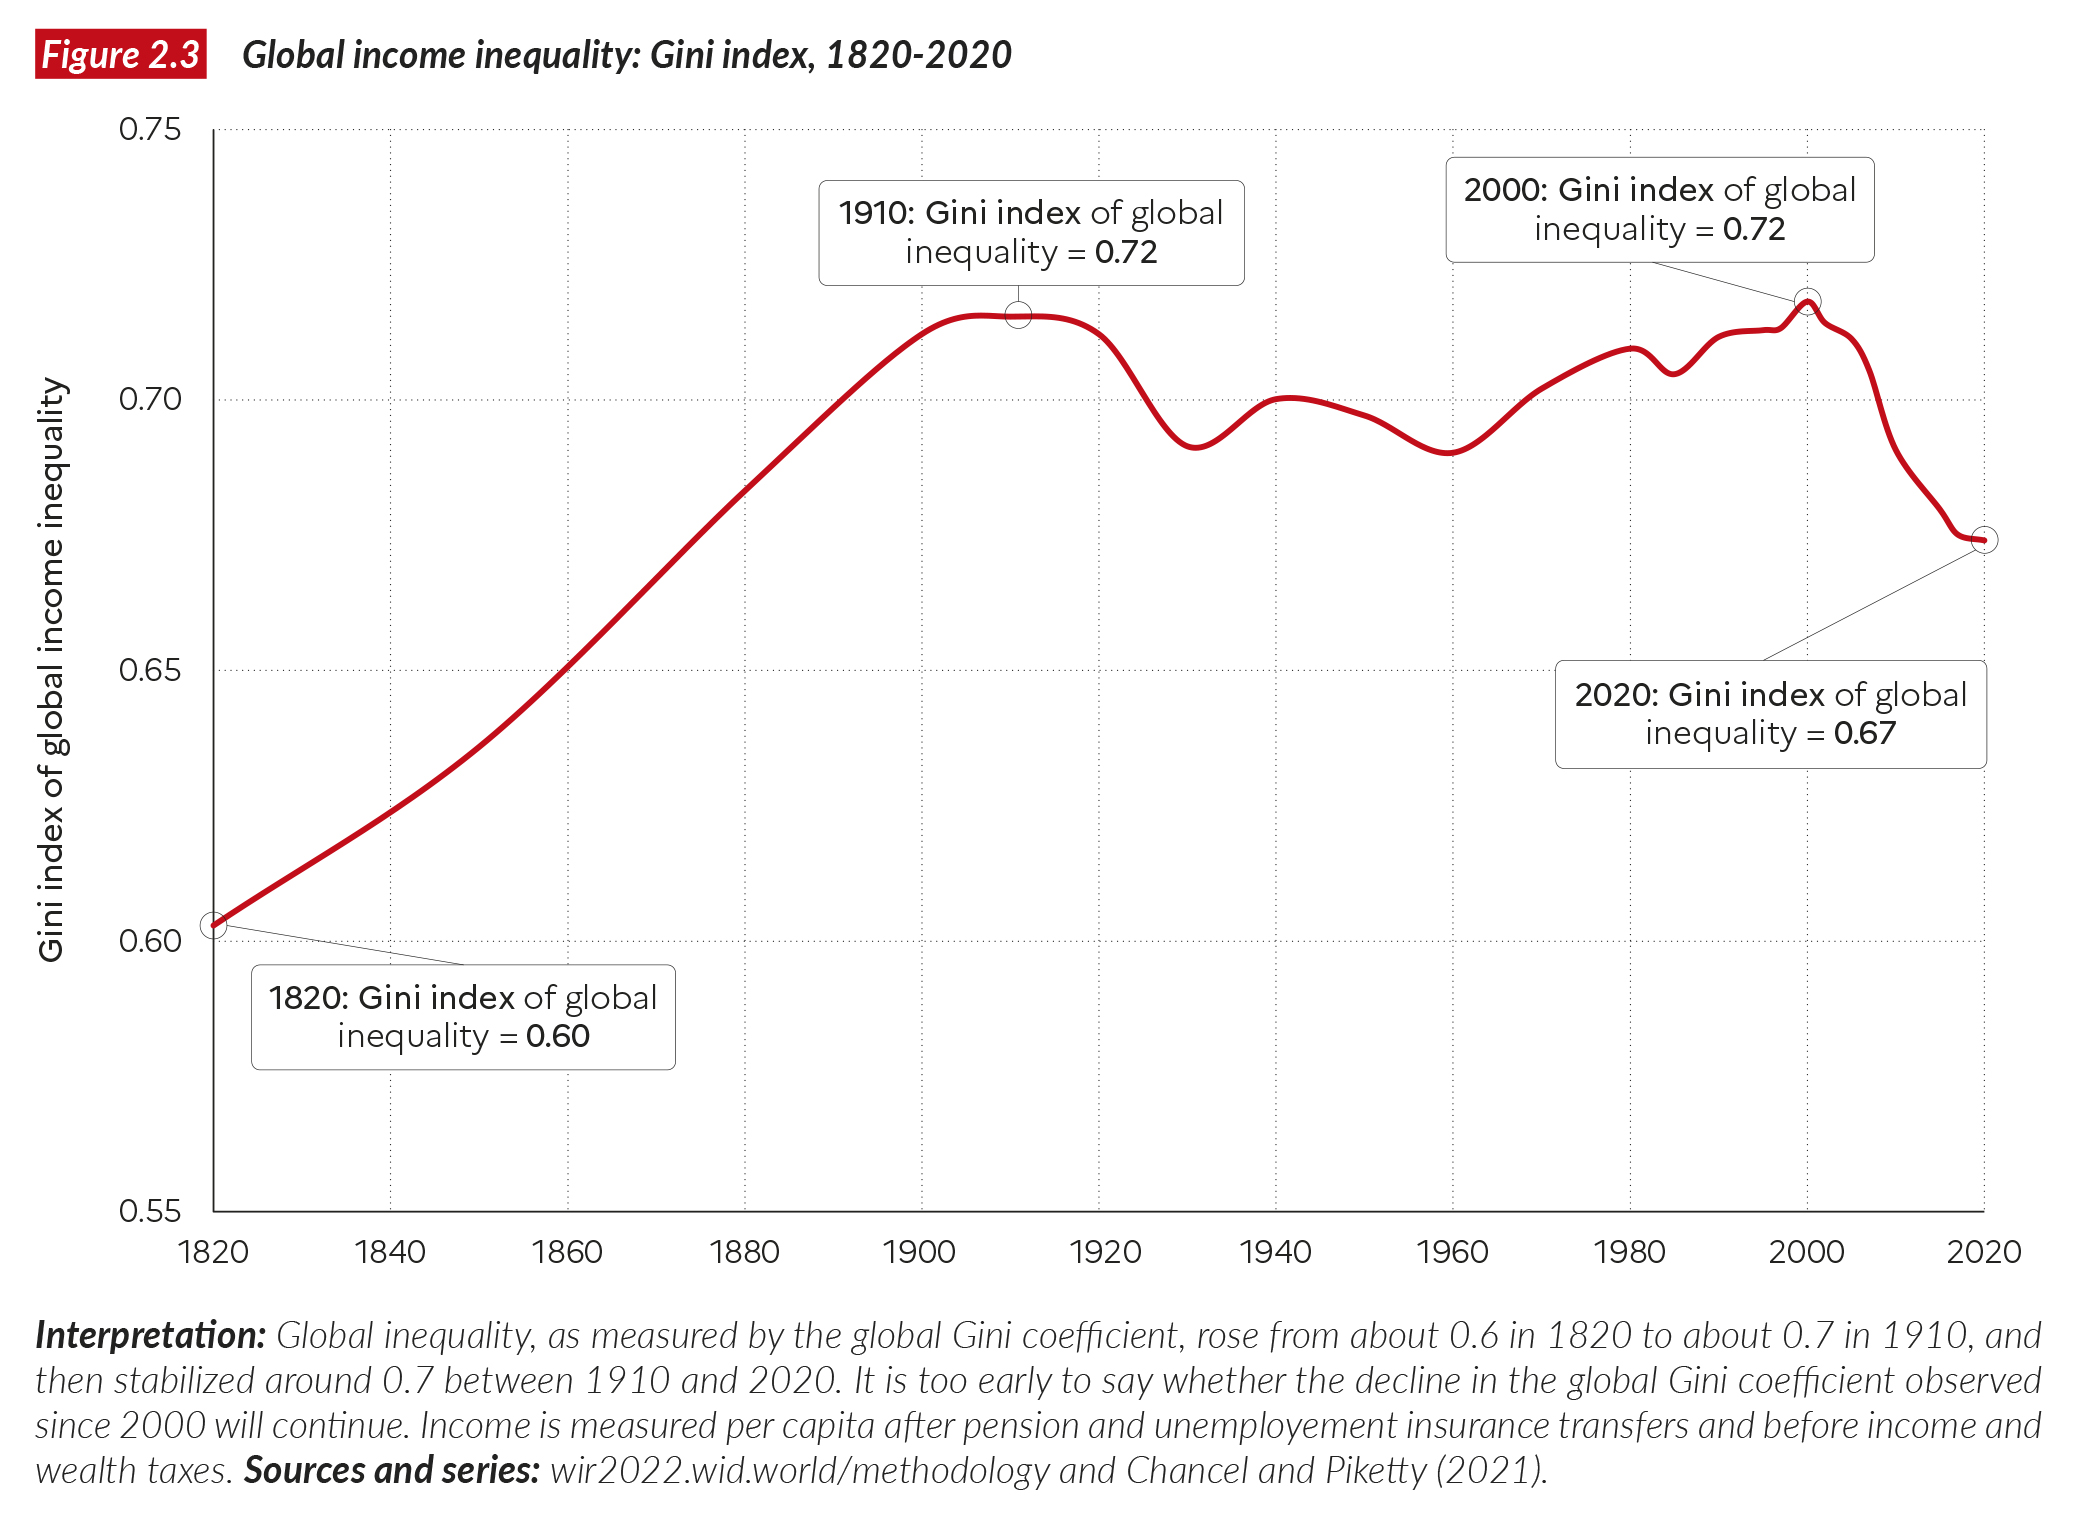
We reach the same conclusion when we look at other indicators, such as the global Gini coefficient. In effect, the global Gini increased from 0.60 in 1820 to 0.72 in 1910, again 0.72 in 2000 and 0.67 in 2020 (see Figure 2.3). Note that the global inequality peak was reached in 2000 according to the Gini coefficient, while it was reached in 1980 (almost on par with 2000) according to the T10/B50 ratio. Whatever the indicator consulted, a global inequality peak was reached twice, first around 1910 and then in 1980-2000, and most of the decline in global inequality took place after the 2008 financial crisis. In all cases, global indicators indicate very high inequality levels in 2020 (close to those observed around 1900-1910, and substantially larger than those observed in 1820).
Within-country and Between-country inequalities are as great in 2020 as in 1910
Figure 2.4 presents two versions of the T10/ B50 inequality ratio: the “within-country” ratio and the “between-country” ratio. The T10/B50 inequality ratio within countries was computed by canceling the component of inequality between countries, i.e. by assuming that all countries have the same average income, and by aggregating the resulting country-level distributions. In effect, this is almost equivalent to computing a form of average of all country-level T10/B50 inequality ratios (weighted by national population size). We find that within inequality (as measured by this indicator) increased gradually between 1820 and 1910, then sharply declined between 1910 and 1980, and finally rose again between 1980 and 2020. This is the familiar pattern, found in the United States and Western Europe in the context of the new wave of historical research on inequality. A similar pattern has also been found in Japan, India, Russia, China, Latin America, South Africa, among other places, so it is not surprising that we find it here at the global level. Note that the rise of within-country inequality since 1980 apparently reached a sort of plateau between 2010 and 2020 (and has not turned back so far). This plateau appears to be comparable in magnitude (or slightly lower) to the plateau of 1910.
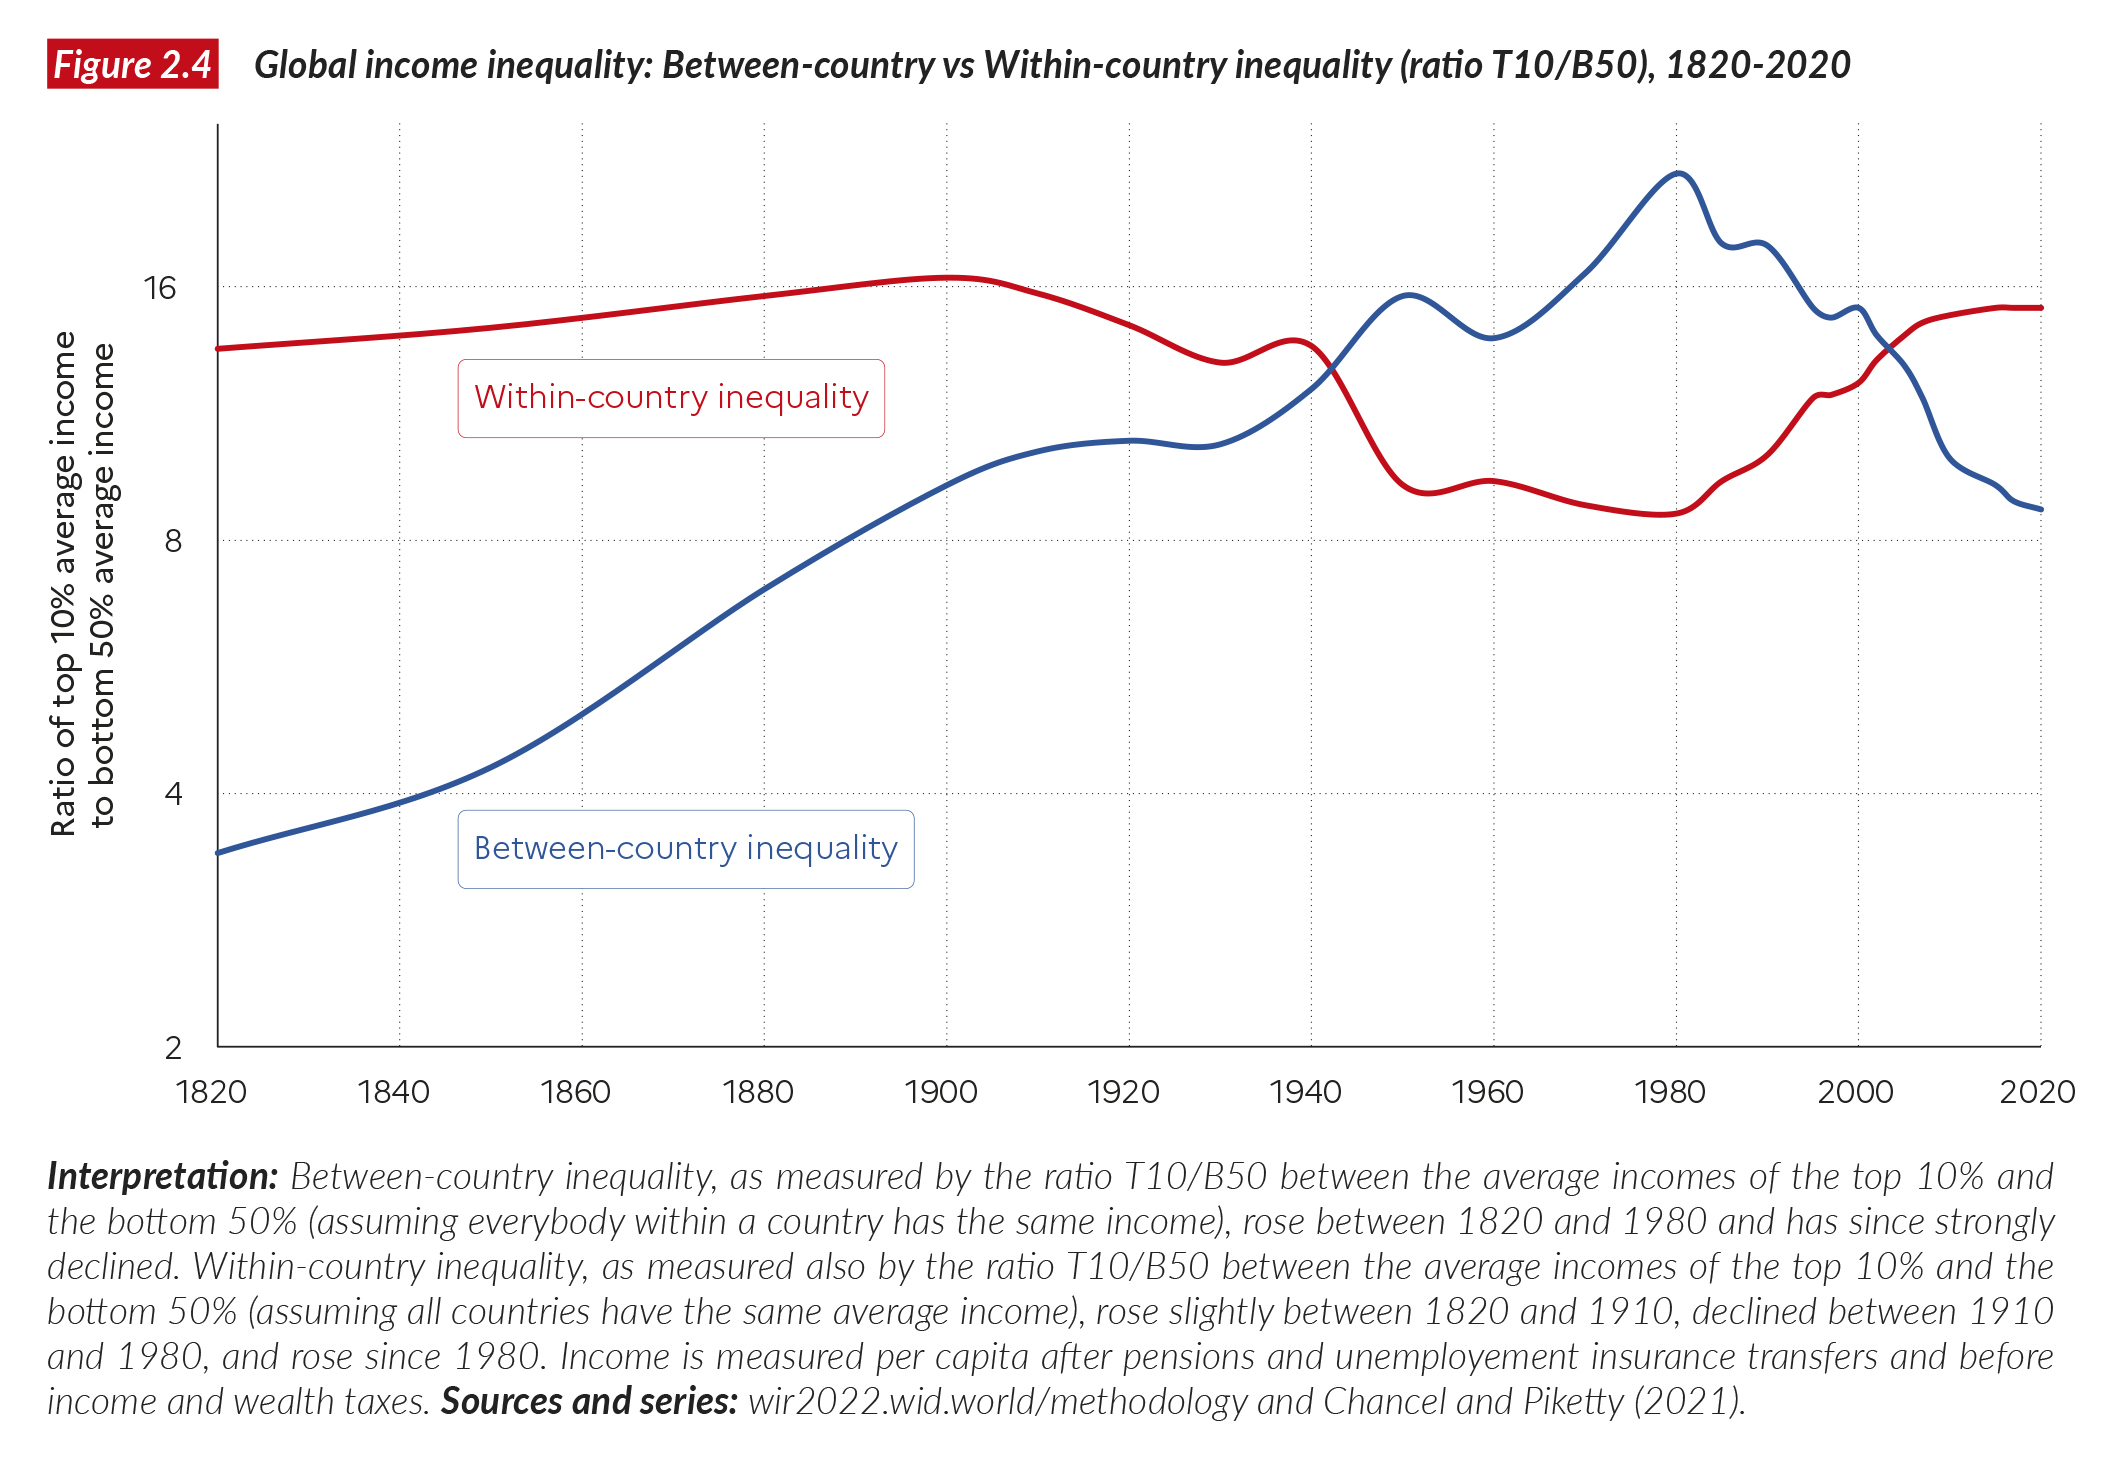
In contrast, the T10/B50 ratio of inequality between countries follows a very different pattern. It was calculated by canceling the within-country inequality component, i.e. by assuming that all inhabitants in any given country have the same income as their country average, and by aggregating the resulting country-level distributions. We find that between-country inequality (as measured by this indicator) increased continuously between 1820 and 1980. In particular, it increased enormously between 1820 and 1950, during the period of colonial empires. In effect, the between-country T10/ B50 more than quadrupled, from less than four in 1820 to almost 16 in 1950. It continued to increase at a slower pace between 1950 and 1980. The between-country T10/B50 income gap was over 20 in 1980, after which it started to decline quickly, down to nine in 2020. It is worth noting that China ceased to be part of the bottom 50% of the world in 2010, so the continuation of the decline after 2010 is due to the high-growth performance of countries like India, Indonesia, Vietnam and some (but not all) Sub-Saharan African countries relative to growth rates in rich countries. We should also stress that despite this decline, Between-country inequality remains very high in absolute terms: in 2020, it is roughly at the same level as it was in 1900.
By comparing the evolution of the global T10/ B50 income gap (Figure 2.2) with the evolution of the within-country and between-country components (Figure 2.4), we now have a clear picture of the long-term transformation of the world income distribution over the past two centuries. Between 1820 and 1910, both components were rising: between-country inequality was rising, as Western countries were establishing their economic and political supremacy over the rest of world, and within-country inequality was also rising (or was quasi-stable at a very high level), reflecting very unequal and hierarchical domestic political and economic systems. Between 1910 and 1980, within-country inequality was greatly reduced, largely due to rising social spending and progressive taxation, but between-country inequality continued to increase, so that the impact on global inequality was ambiguous. The opposite occurred between 1980 and 2020: within-country inequality started to rise again, while between-country inequality declined, so that the effect on synthetic inequality indicators like the global T10/B50 income gap was again ambiguous. In the most recent period, however, and especially since the 2008 financial crisis, the declining inequality effect clearly dominates. This is because the rise of within-country inequality seems to have reached a plateau between 2010 and 2020 (in both the North and the South), while simultaneously, the decline in between-country inequality accelerated (due in part to relatively poor growth performance in rich countries post-2008, especially in Europe, compared with growth rates in developing and emerging countries). At the same time, global inequality remains very high in absolute terms: in 2020 it is close to the level observed around 1900.
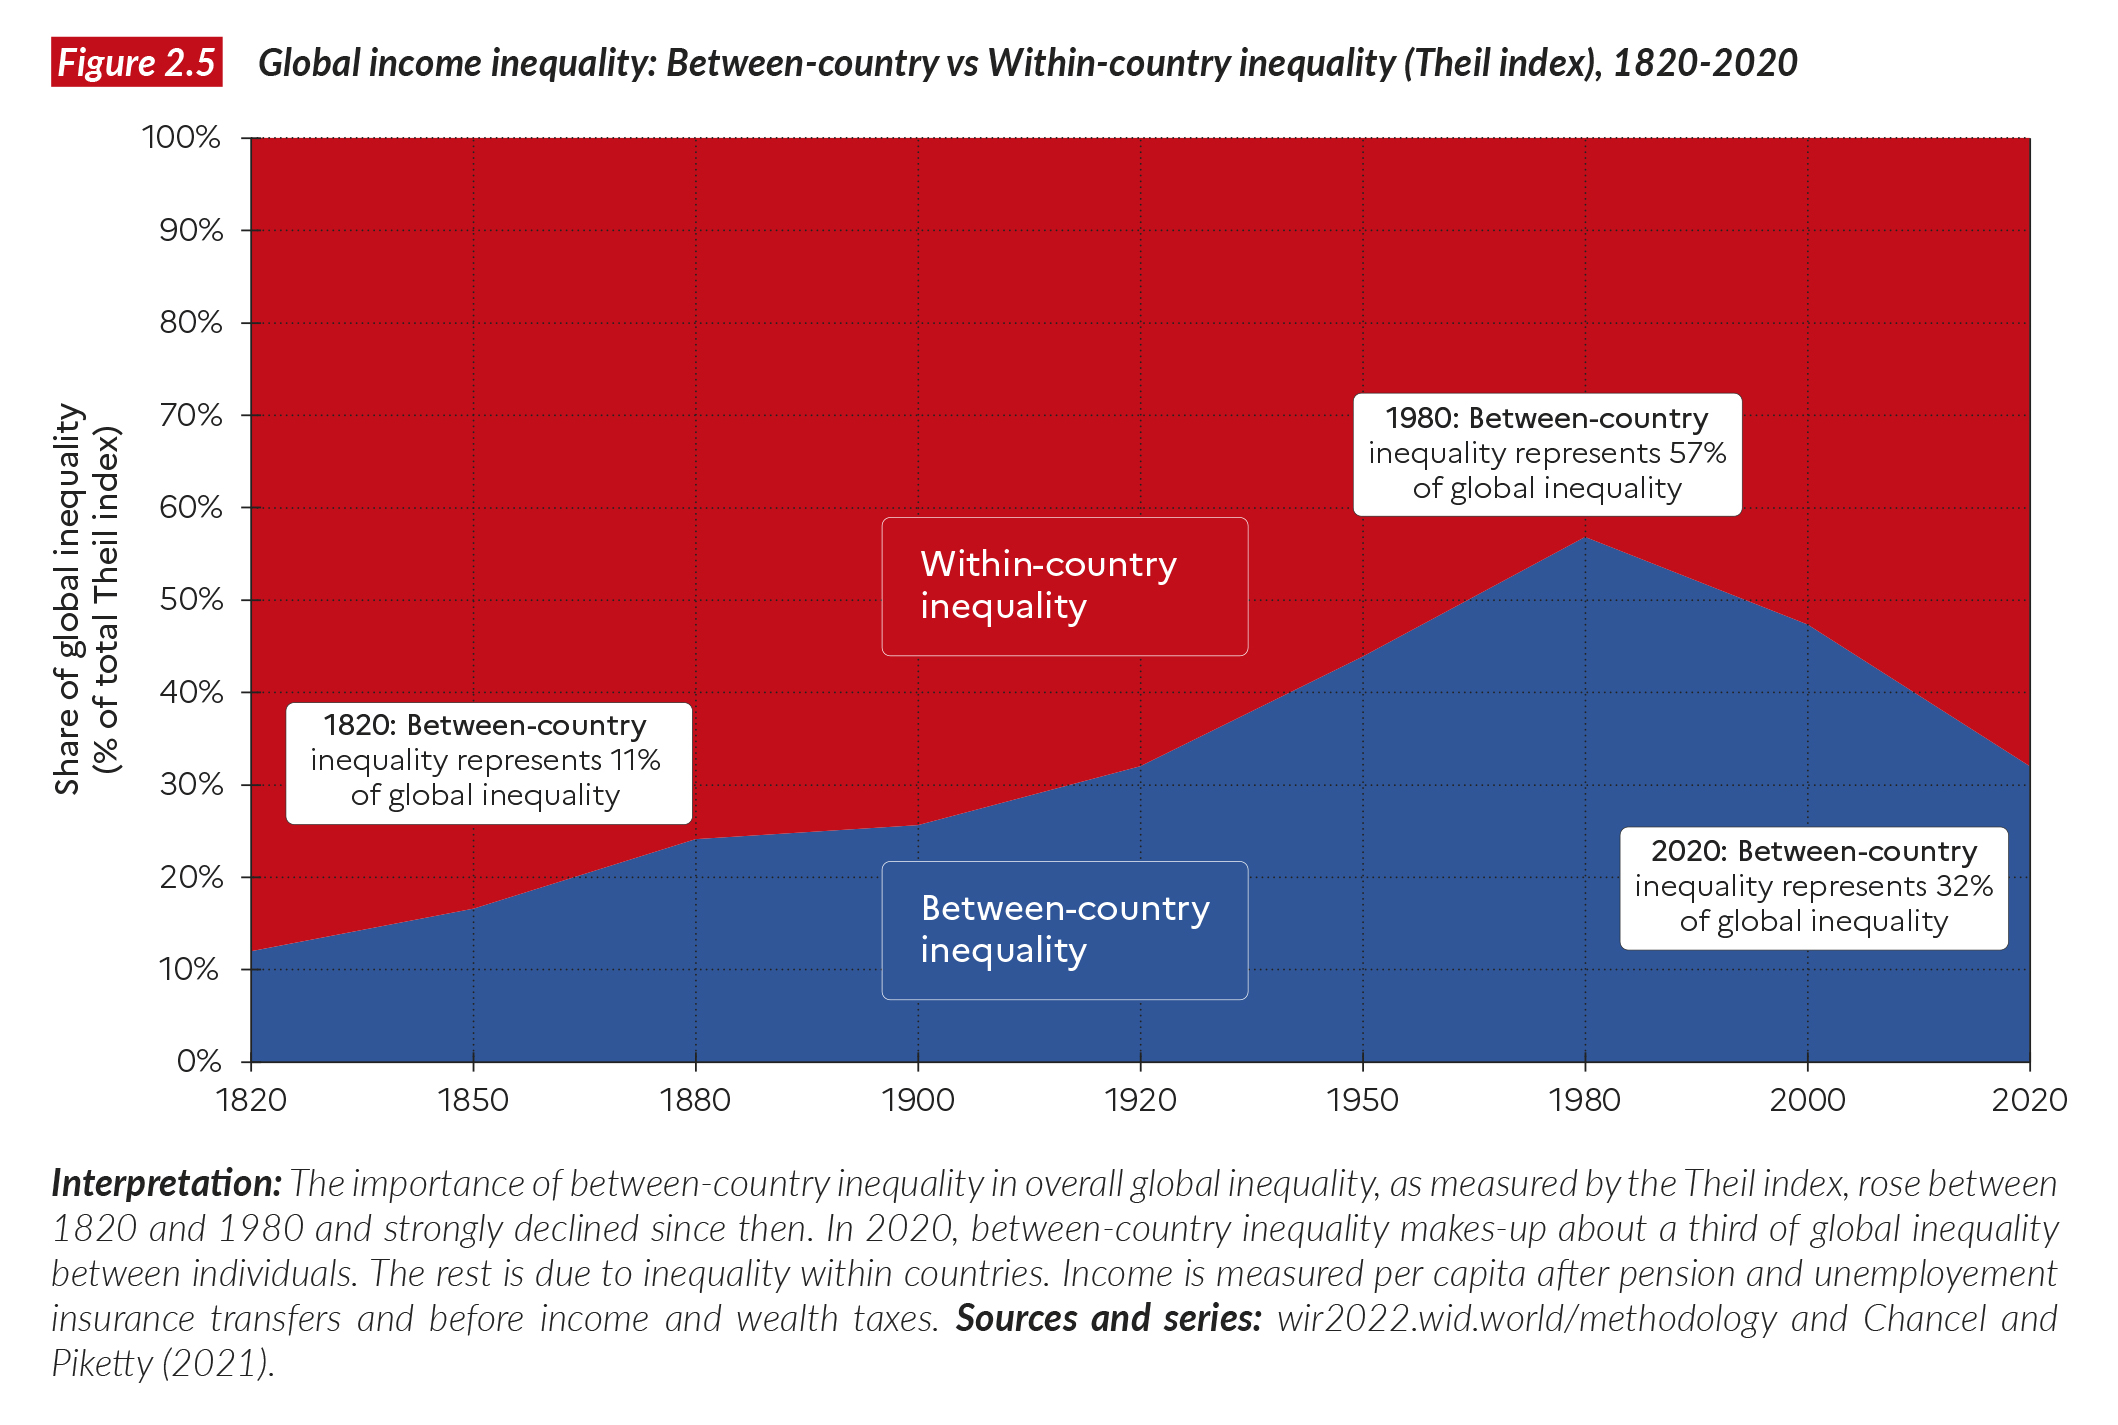
We reach the same conclusion regarding the breakdown of global inequality trends into within-country and between-country components if we use other indicators, such as the Theil index (which allows for additive decompositions, see Figure 2.5). Namely, the between-country component was relatively small in 1820 (around 10% of global inequality). It rose substantially between 1820 and 1980 (when it was quantitatively larger than the within-country component, reaching more than 55% in 1980), before declining sharply since then (to arrive at around 30% in 2020)2.
The global economic elite never fully recovered its Belle Époque opulence
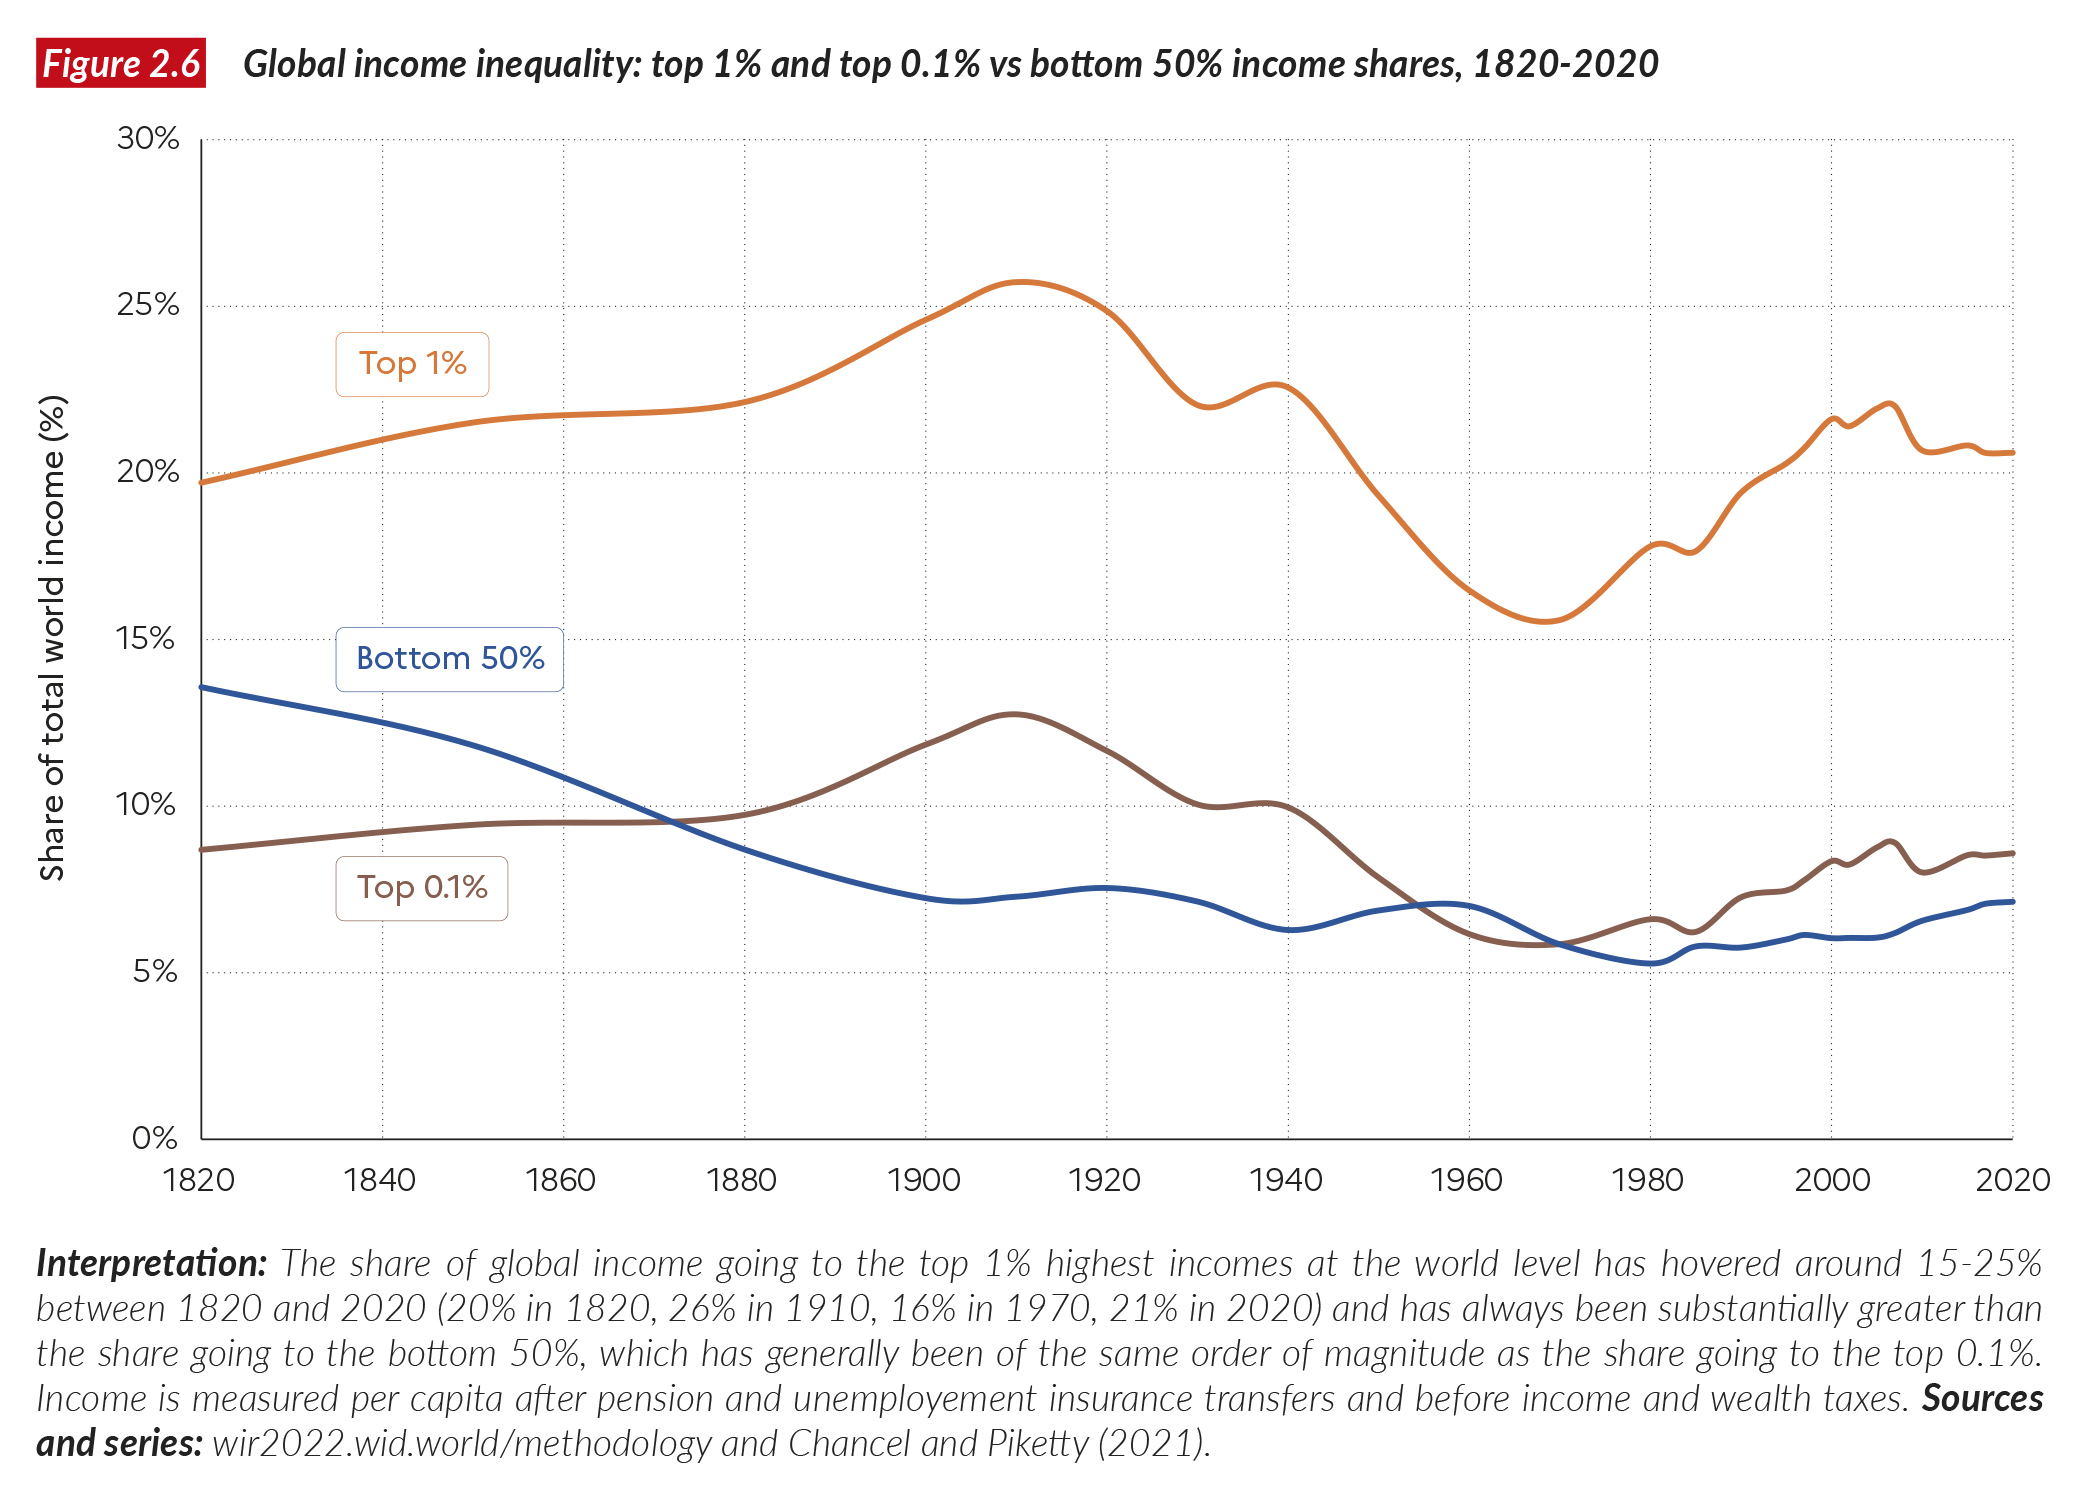
Our global inequality series also allow us to study finer inequality indicators focusing on specific segments of the distribution, such as very top incomes. According to our estimates, the global top 1% share rose from 20% of total income in 1820 to 26% in 1910, before dropping to 16% in 1970 and rising again to 21% in 2020. Between 1880 and 2020, the global top 1% share was generally three to four times larger than the share of the bottom 50% (6%-9% of total income), which has typically been of the same order of magnitude as the top 0.1% share (see Figure 2.6). For instance, both the bottom 50% income share and the top 0.1% share are about 8% of total income in 2020. This illustrates the extreme degree of global income inequality. It implies, for example, that a redistributive policy based on a reduction of one quarter or one third of the incomes of the top 0.1% could have a very significant impact on the incomes of the bottom 50% and on global poverty rates.
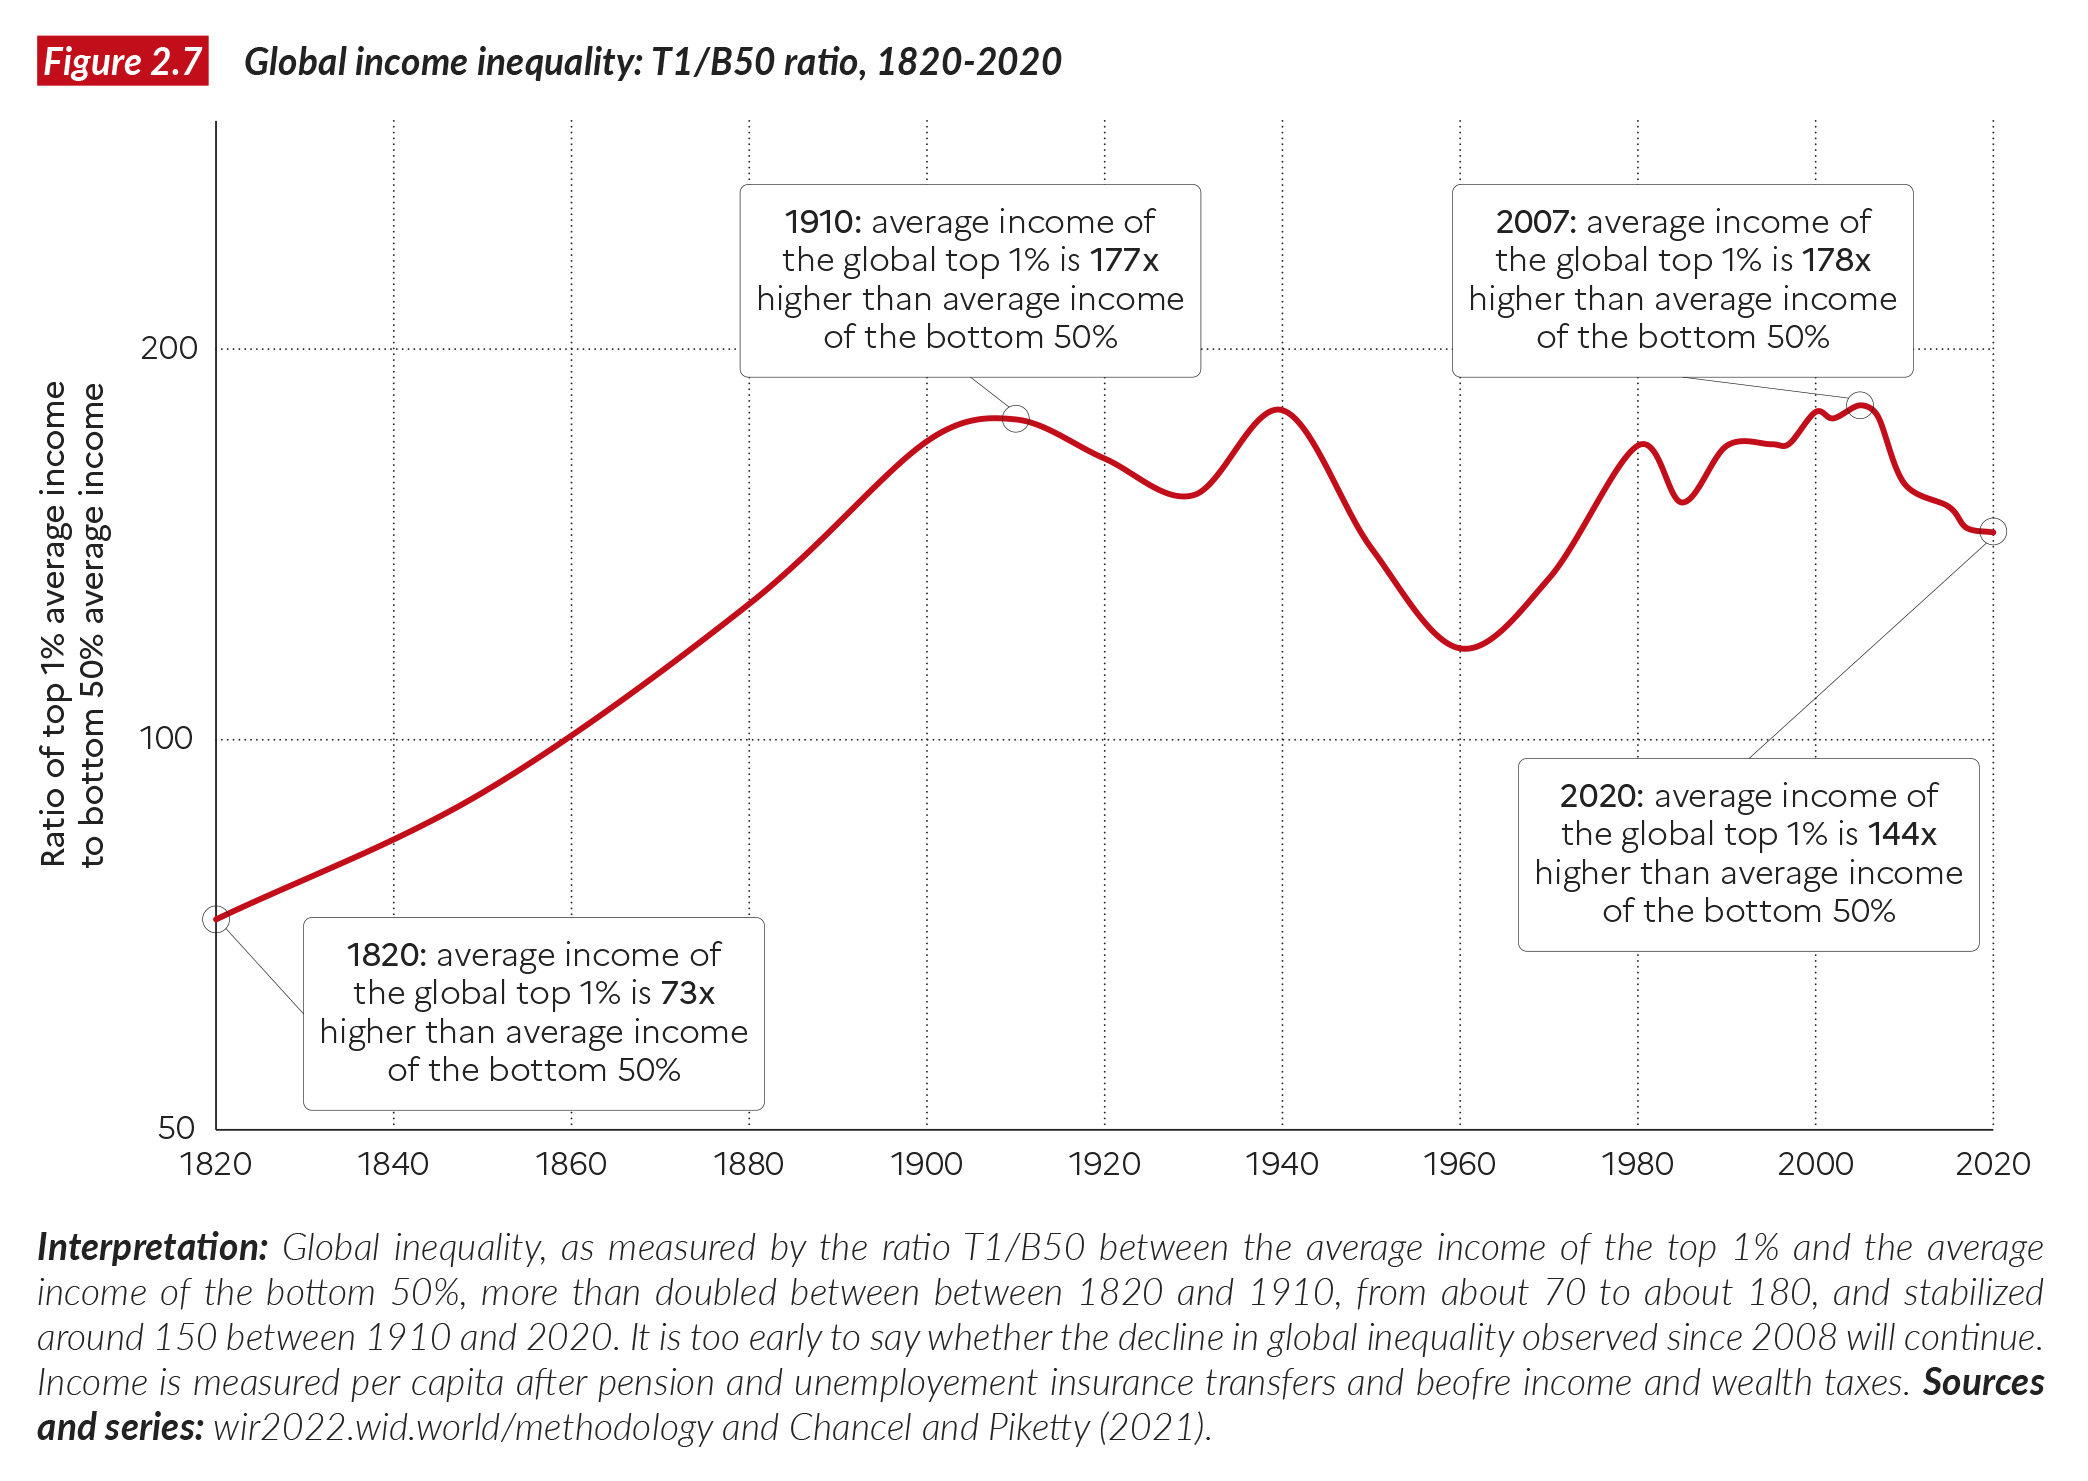
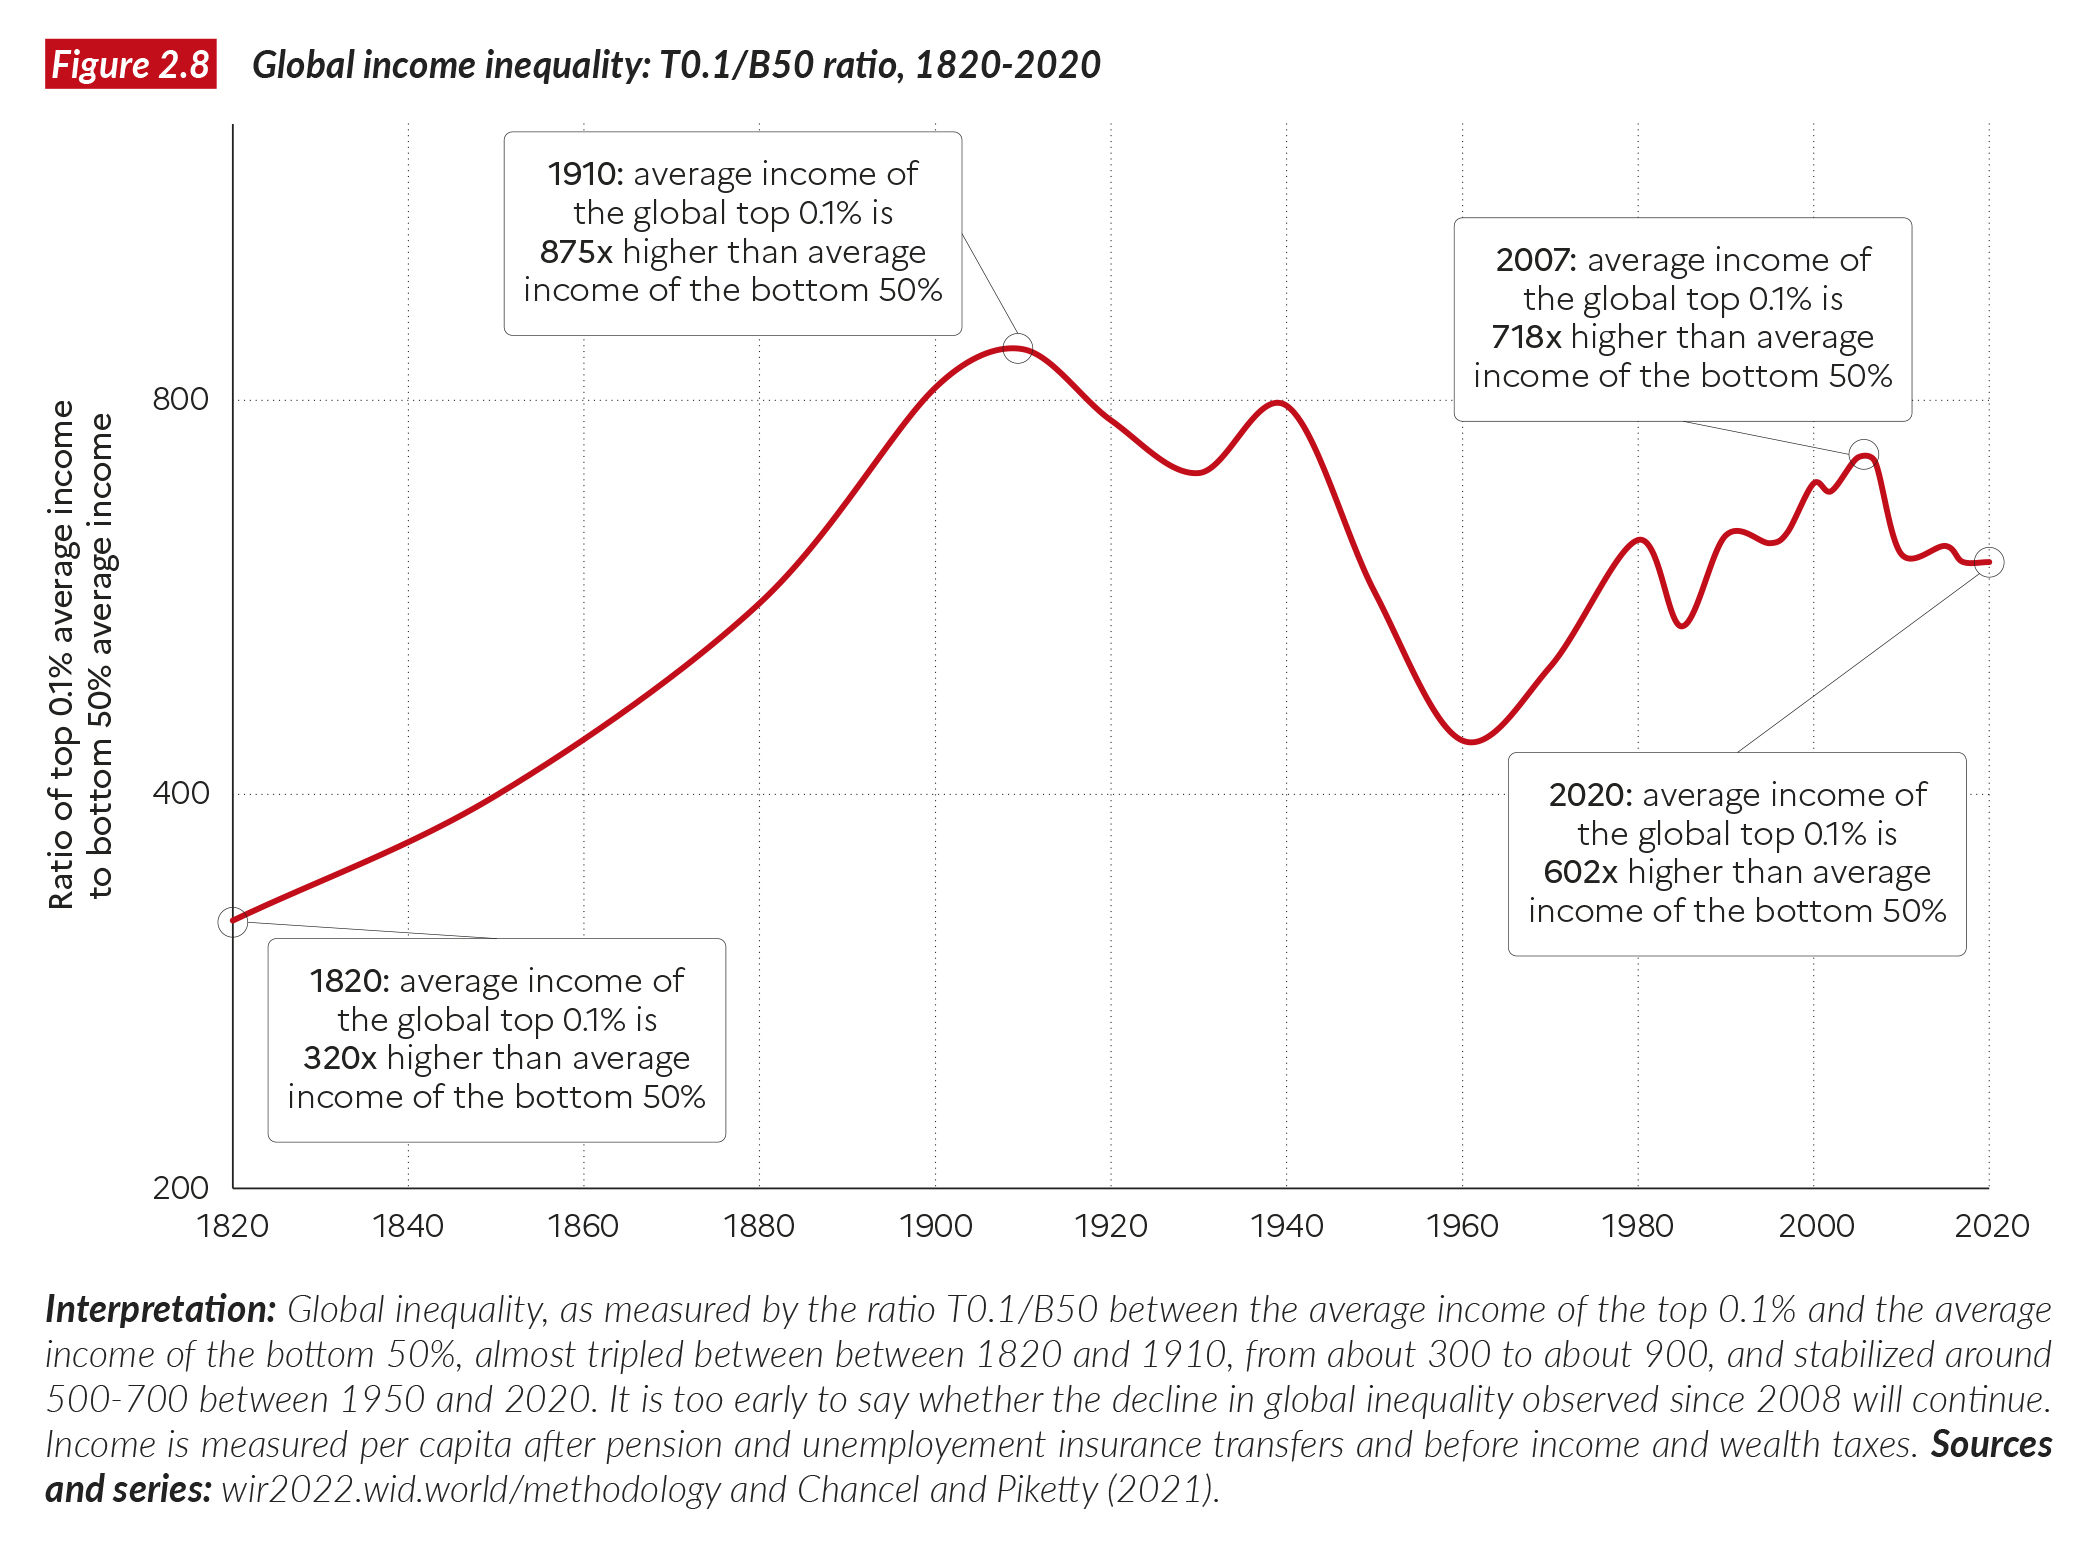
Looking at the ratio between the average incomes of the global top 1% and the global bottom 50%, we see that this inequality indicator rose from about 70 in 1820 to 180 in 1910, and then stabilized around 150 between 1910 and 2020 (see Figure 2.7). Note that the T1/B50 ratio is always much larger than 50, which is simply another way to say that the top 1% share is much bigger than the bottom 50% share. If we look at the ratio between the average incomes of the global top 0.1% and the global bottom 50%, we find that this indicator rose from about 300 in 1820 to 900 in 1910, before stabilizing around 500-700 between 1910 and 2020 (see Figure 2.8). A ratio T0.1/B50 equal to 500 would mean that each of social classes has the same income share. What is notable is that the T0.1/B50 ratio reached its historical peak in 1910, while other inequality indicators like the T10/B50 ratio, the Gini coefficient, and the T1/B50 ratio reached their historical peaks around 1980-2010. This illustrates the fact that top- end inequality never fully returned to its Belle Époque 1910 high point, especially in Europe, which dominated the world economy and the top of the distribution at the time.
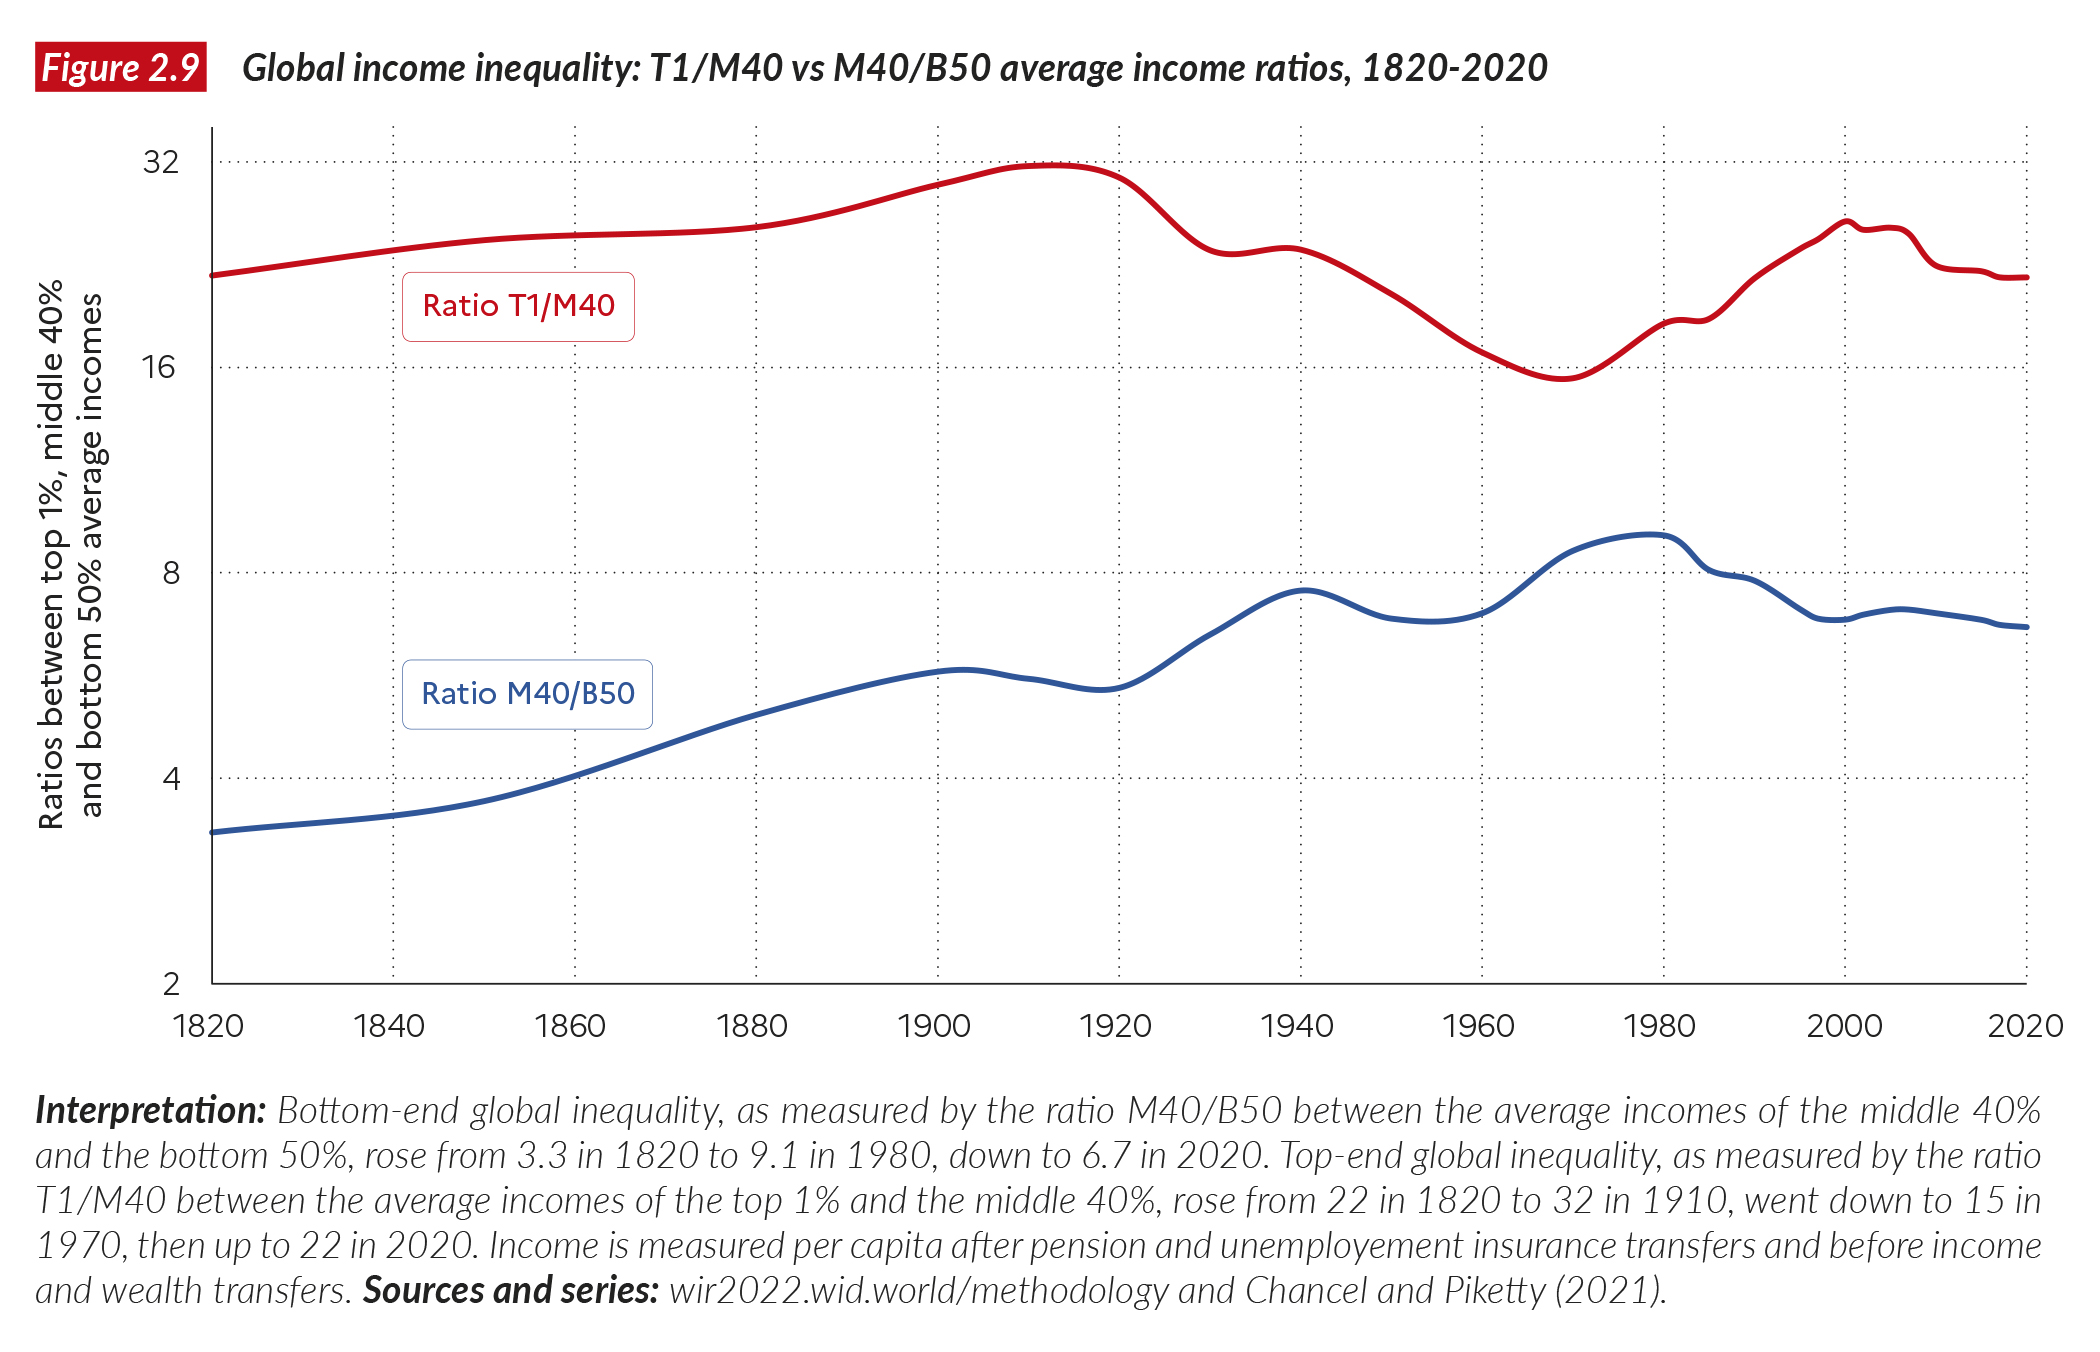
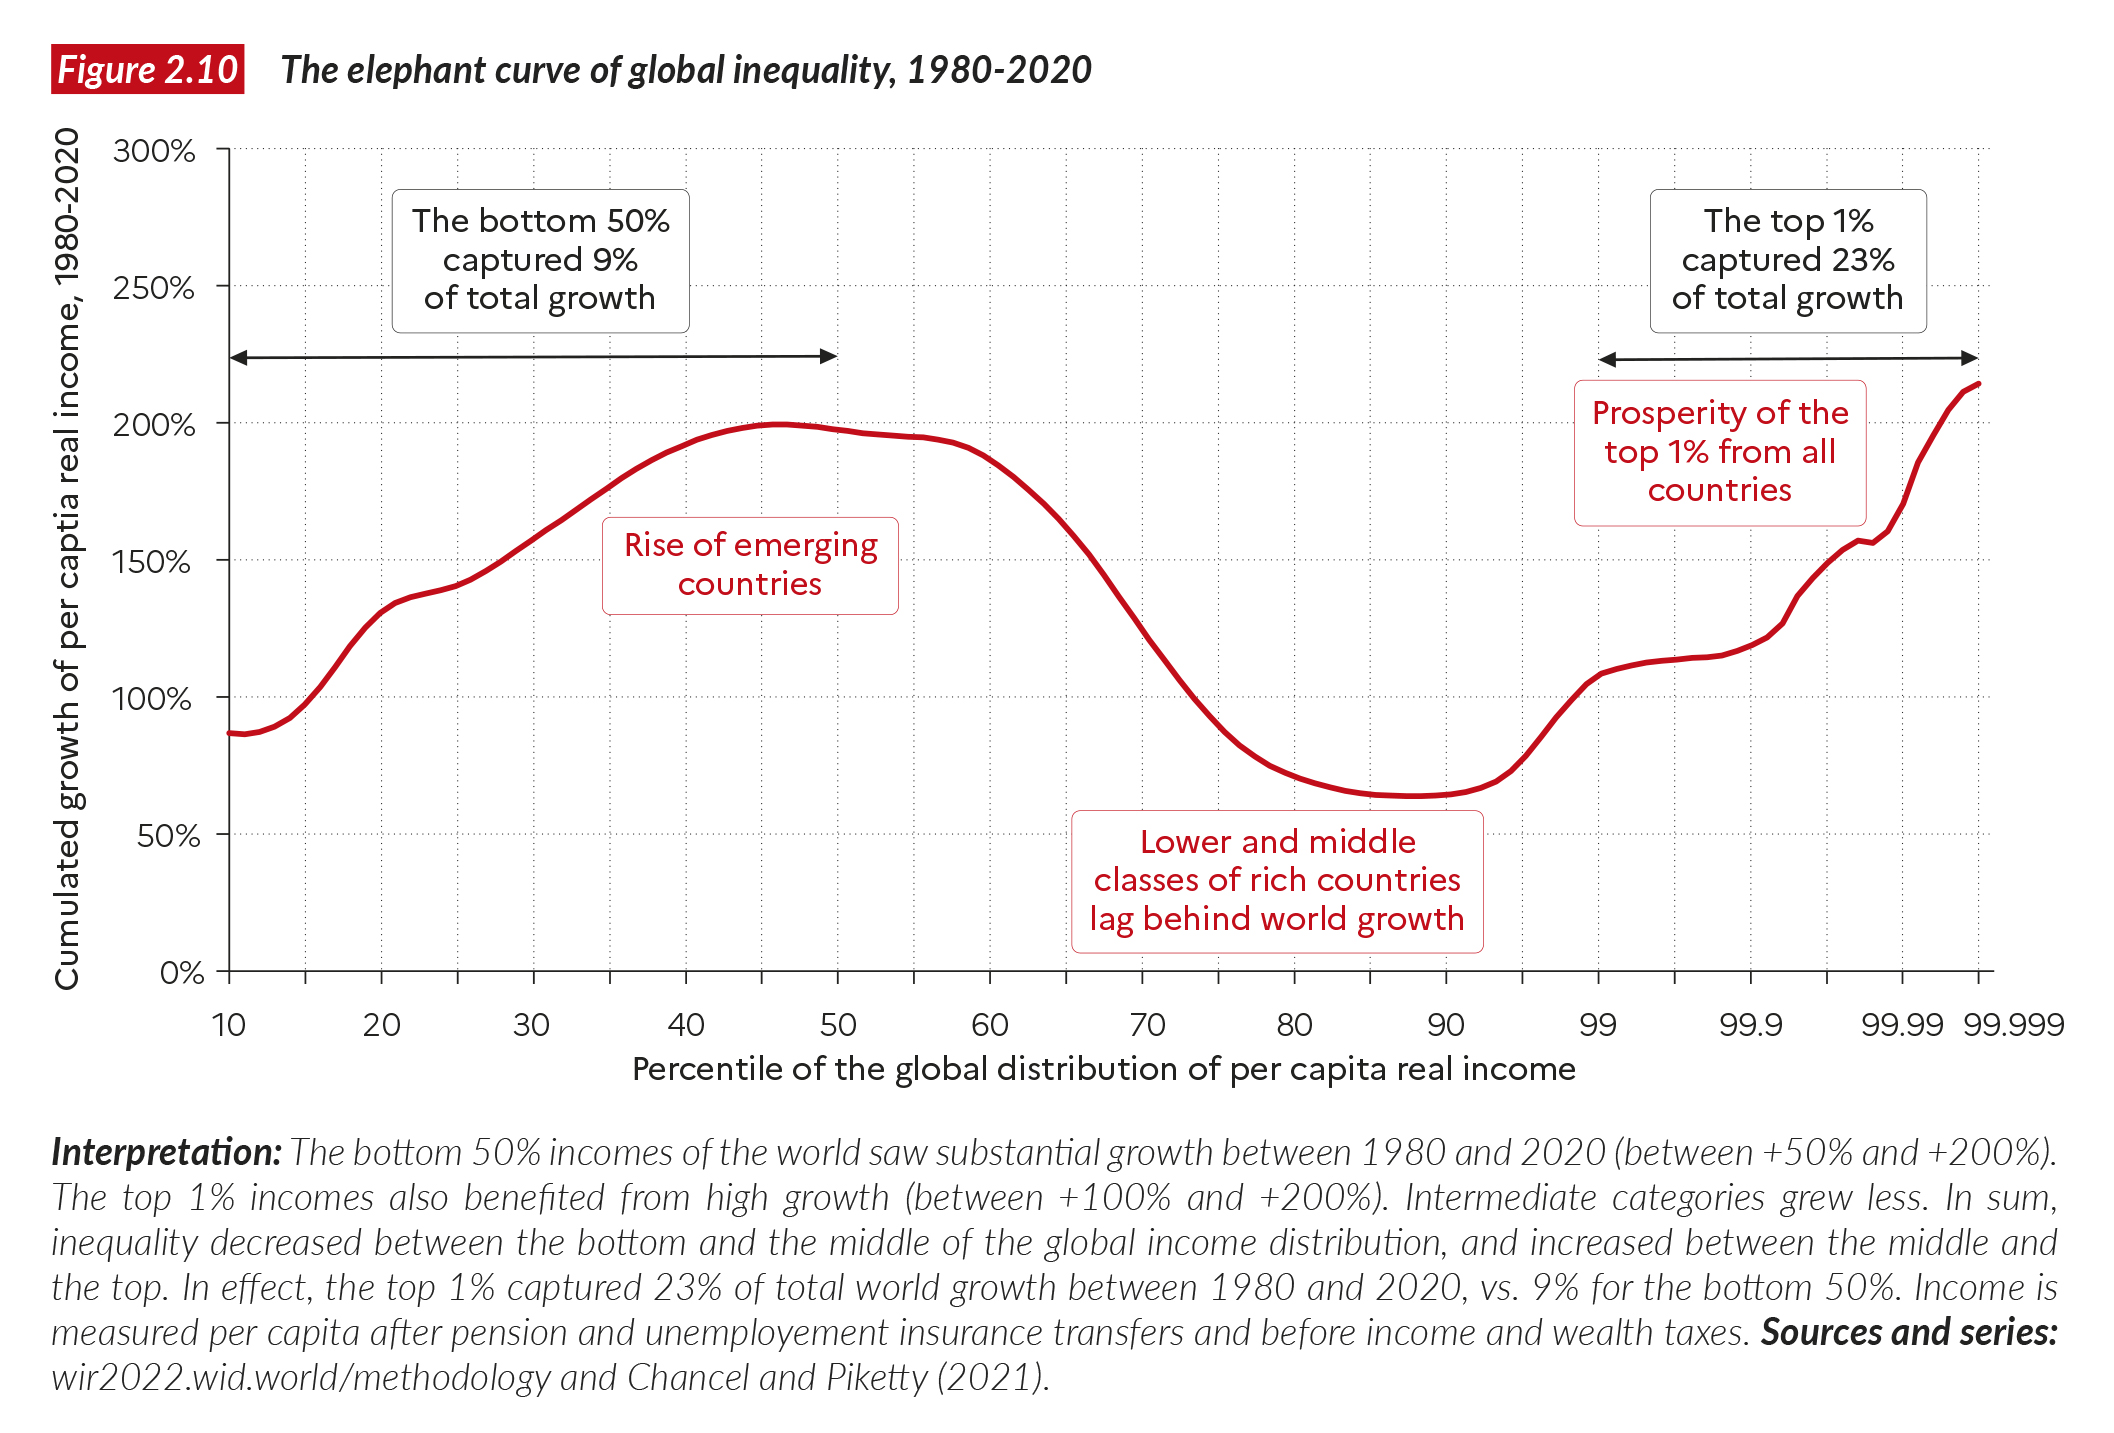
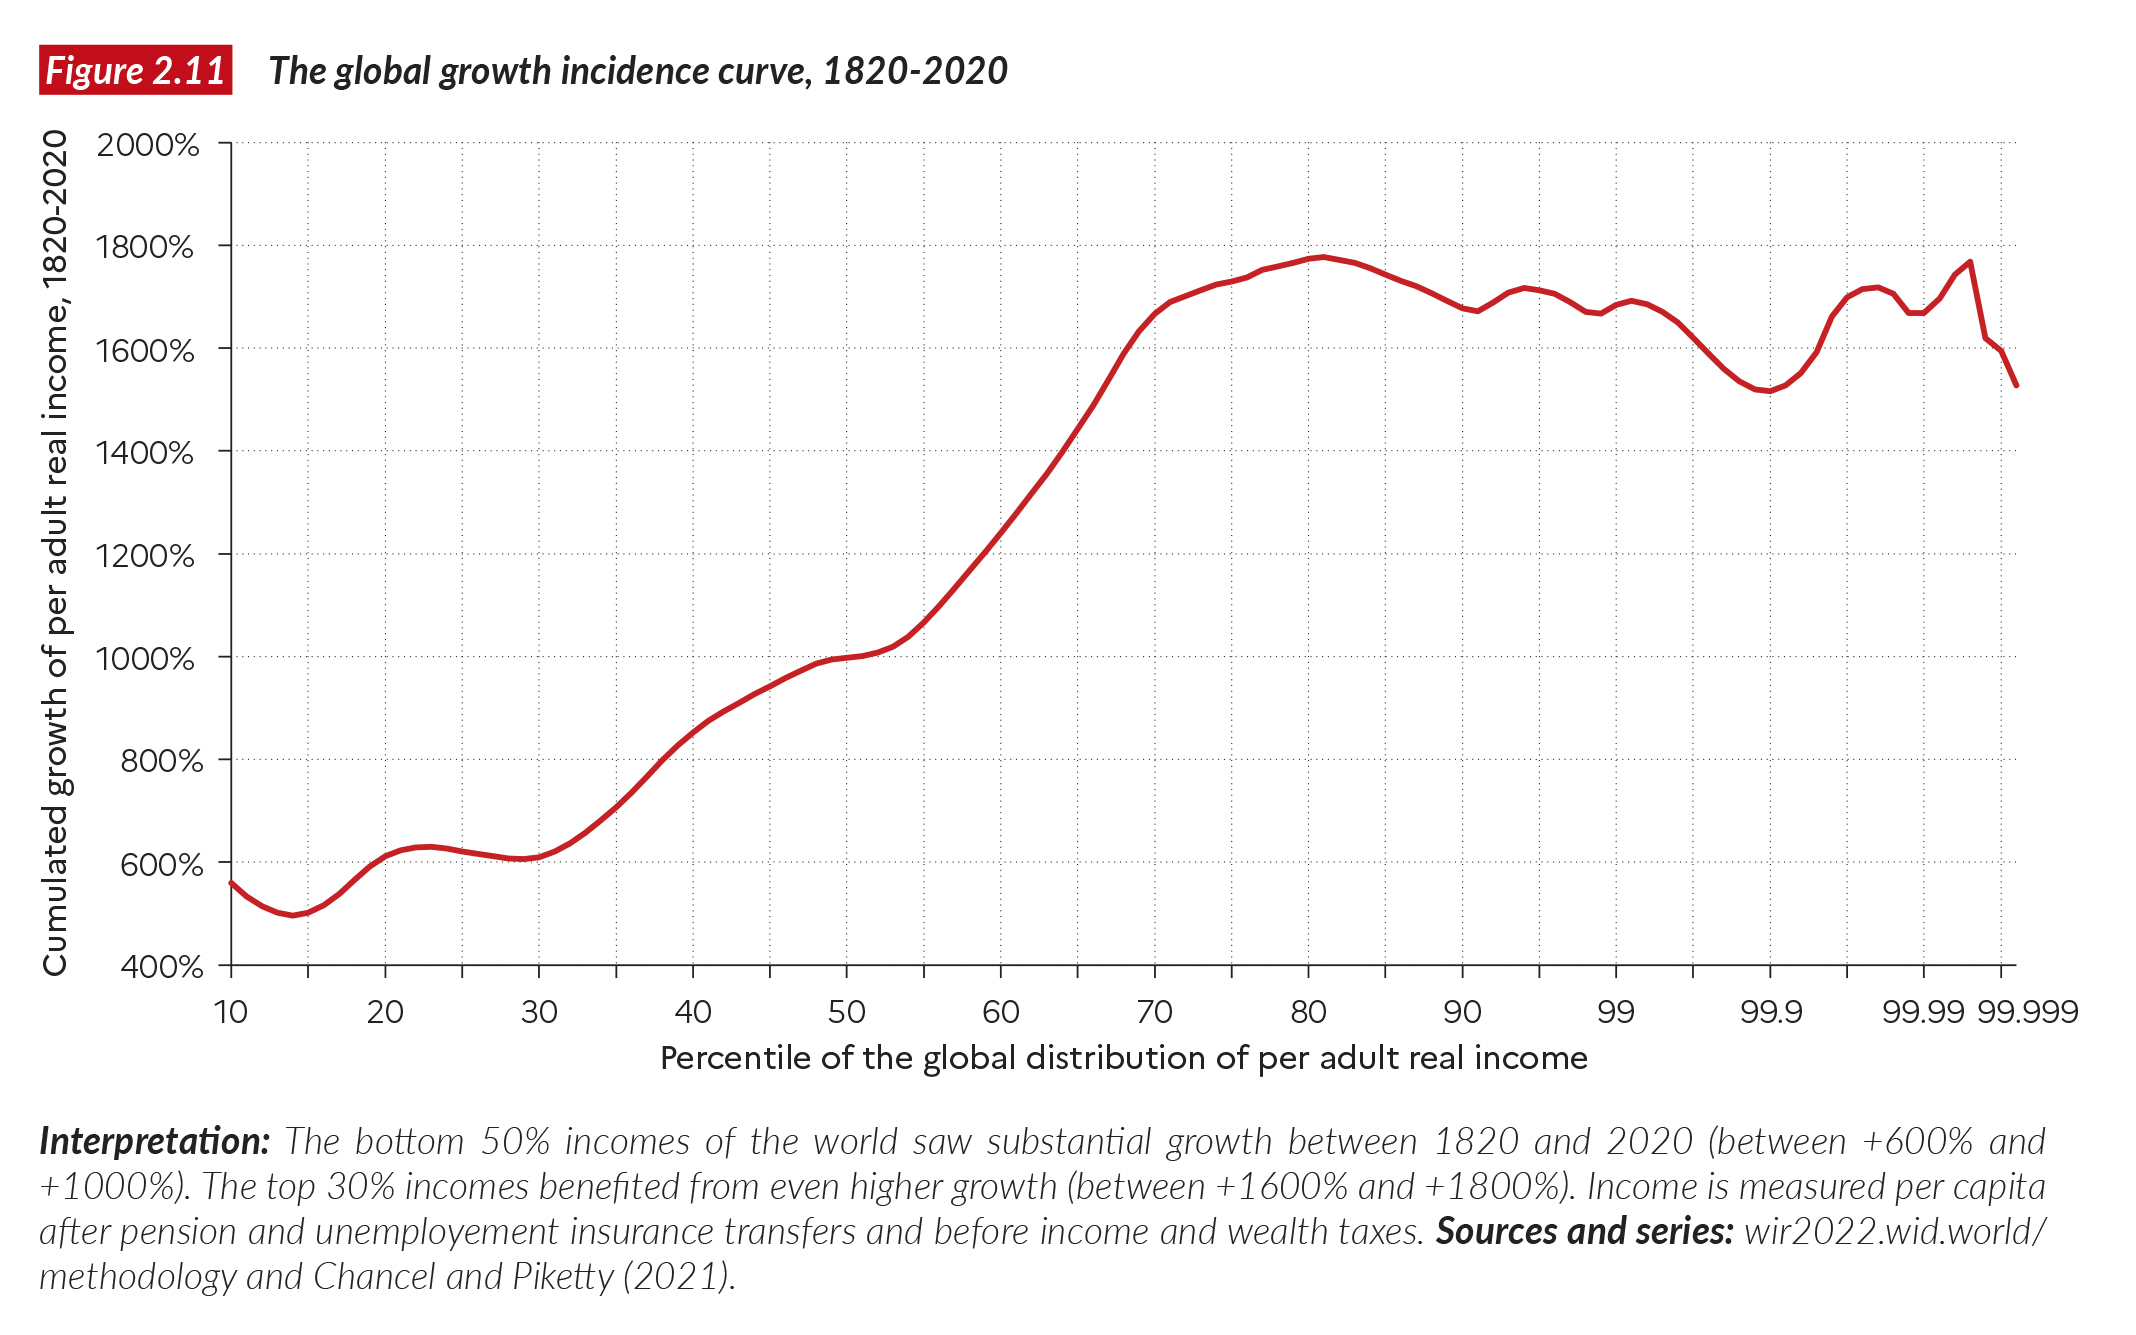
The evolution of the global T1/B50 ratio can also be broken down into two components: inequality between the top and the middle of the distribution, as measured by the ratio T1/M40, and inequality between the middle and the bottom of the distribution, as measured by the ratio M40/B50. If we do this, we see that the two components moved in opposite directions between 1980 and 2020: global inequality between the top and the middle of the distribution increased, but it declined between the middle and the bottom of the distribution (see Figure 2.9). Another way to visualize this is the well- known “elephant curve” of global inequality between 1980 and 20203. That is, if we look at cumulative income growth over the 1980- 2020 period, we find that the two groups that have benefited from the highest growth performance are the bottom 50% and the top 1% (see Figure 2.10). In contrast, if we look at the growth incidence curve over the entire 1820-2020 period, we find that it is upward sloping: the global top 30% have benefited from an increase in their purchasing power over the past two centuries roughly twice as great as that for the global bottom 50% (see Figure 2.11). This reflects the fact that global inequality in 2020 is still substantially greater than in 1820.
The regional decomposition of global inequality: Back to 1820?
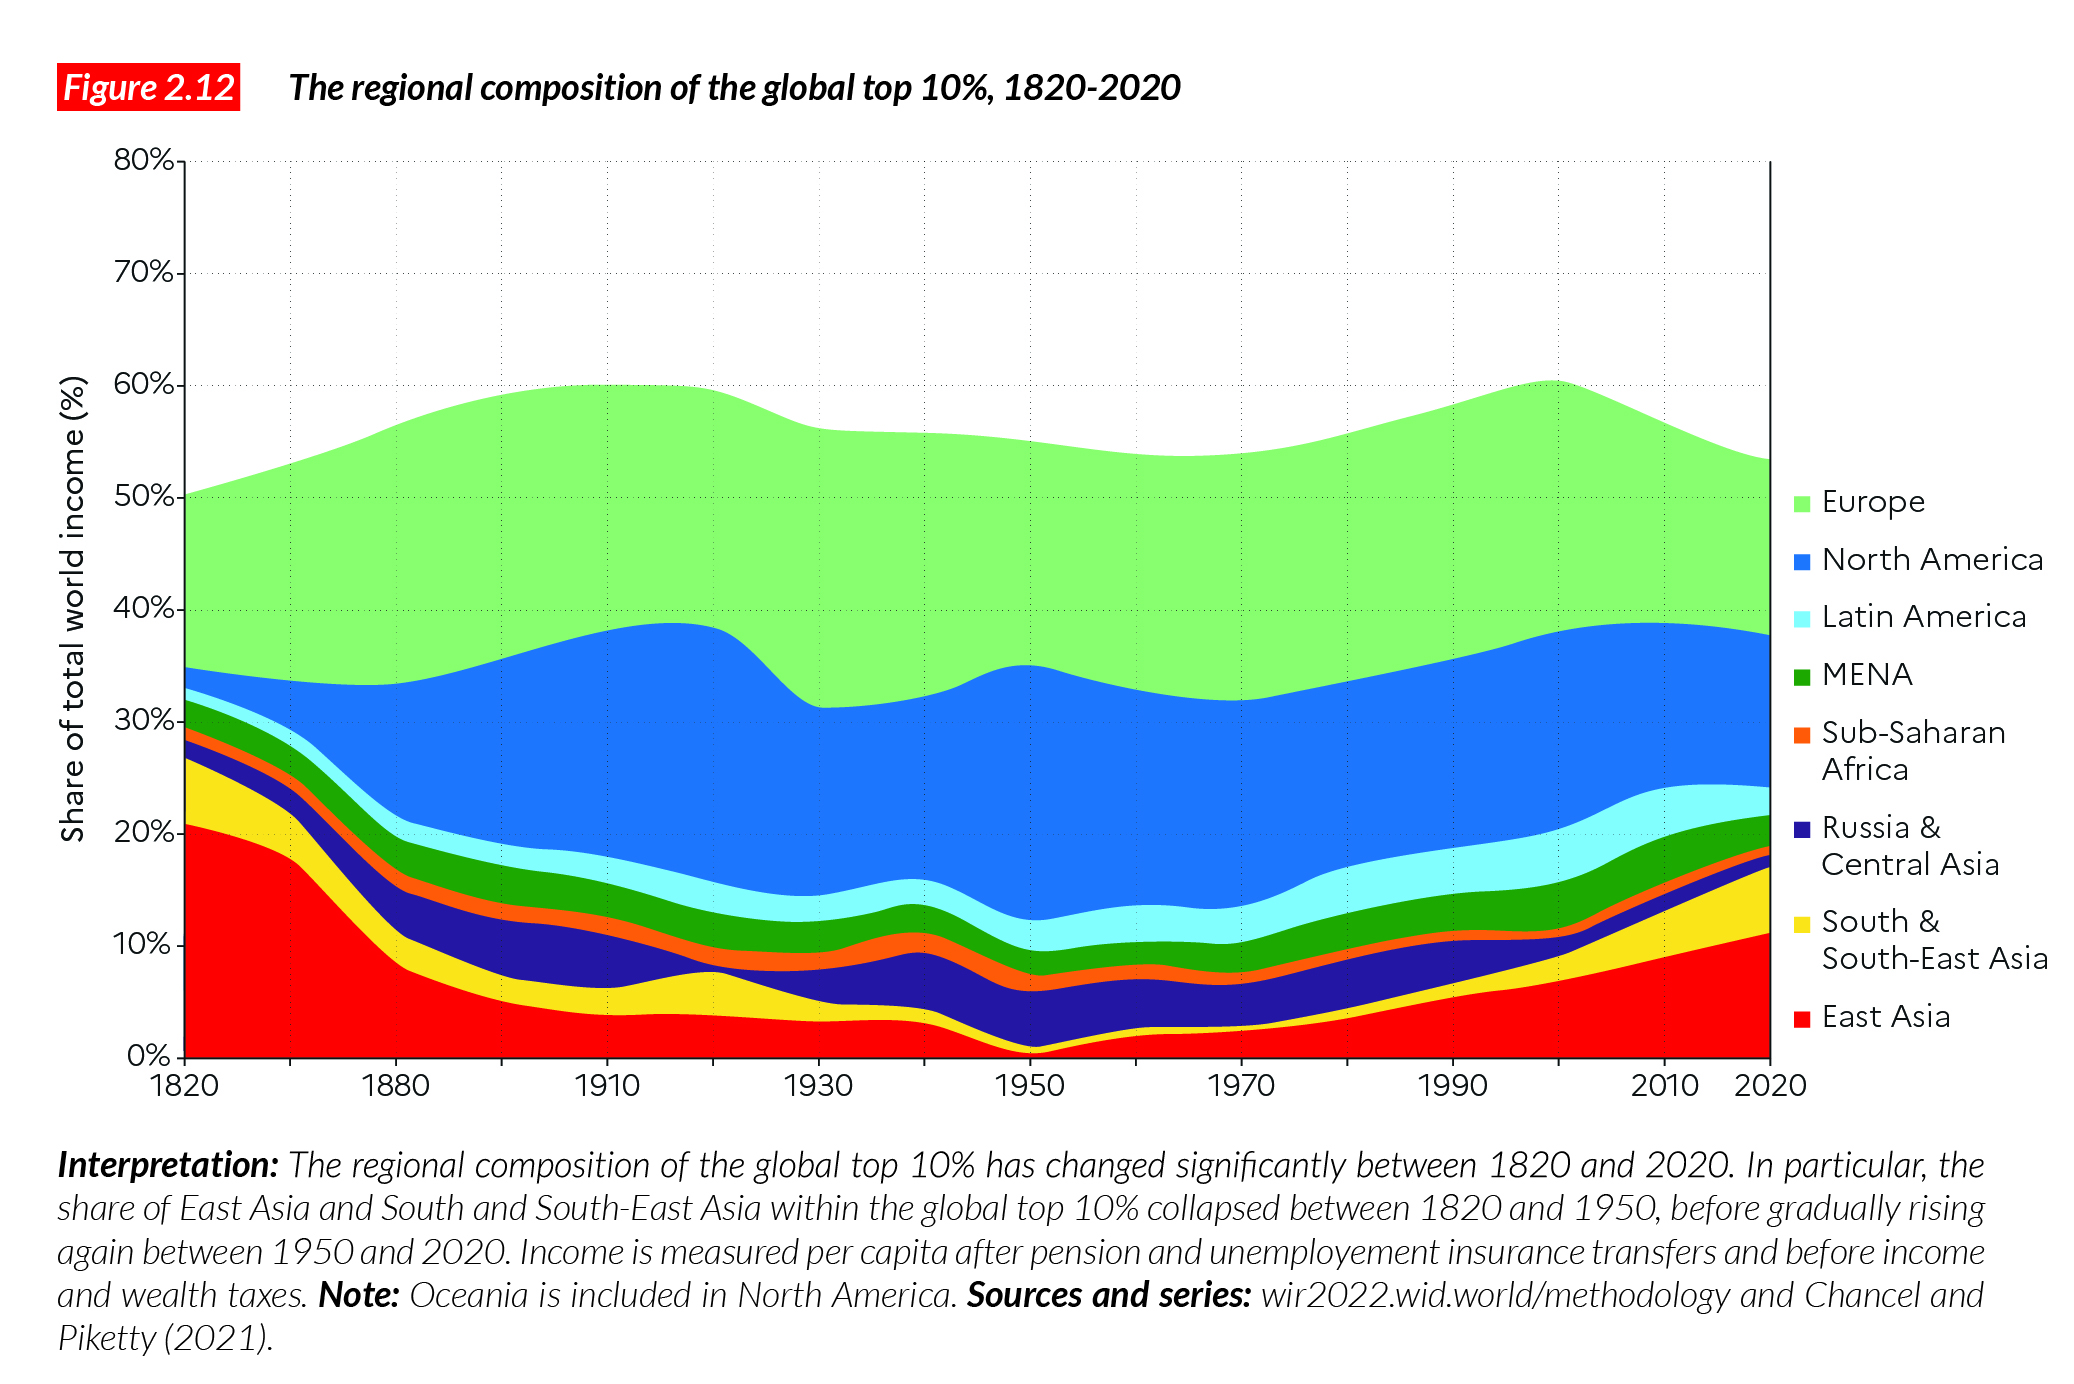
If we look at the regional composition of the global top 10%, we find that the undisputed dominant position that Europe occupied between 1880 and 1910 has been shared with North America since the 1920s (see Figure 2.12). The share of top 10% income holders coming from East Asia, and South and Southeast Asia has increased gradually since 1950, with an acceleration since 1980, but the Western dominance of the global top 10% remains striking.
We find the same general pattern for the regional composition of the global top 1%, with two interesting caveats.
First, the dominant position of Europe largely collapsed after World War I (and never fully recovered), so that North America has been the undisputed leader of the global top 1% since around 1930. Next, it is worth noting that the global top 1% includes, in recent decades, a relatively large fraction of people from the Middle East, Latin America and Russia. In effect, these regions play a substantially bigger role in the global top 1% than in the global top 10%, reflecting the fact that their rates of within-country inequality are very high.
Looking at the regional composition of the global bottom 50%, we see the declining importance of East Asia, and the rising shares of South and Southeast Asia, and especially Sub-Saharan Africa in recent decades (see Figure 2.13). Note also that almost nobody from Europe or North America has set foot in the global bottom 50% since the mid-20th century. The European poor did, however, constitute a significant proportion of this group back in the 19th century. In contrast, the global middle 40%to day is very diverse and draws significant populations from all regions: the regional shares are relatively close to the shares of the total population.
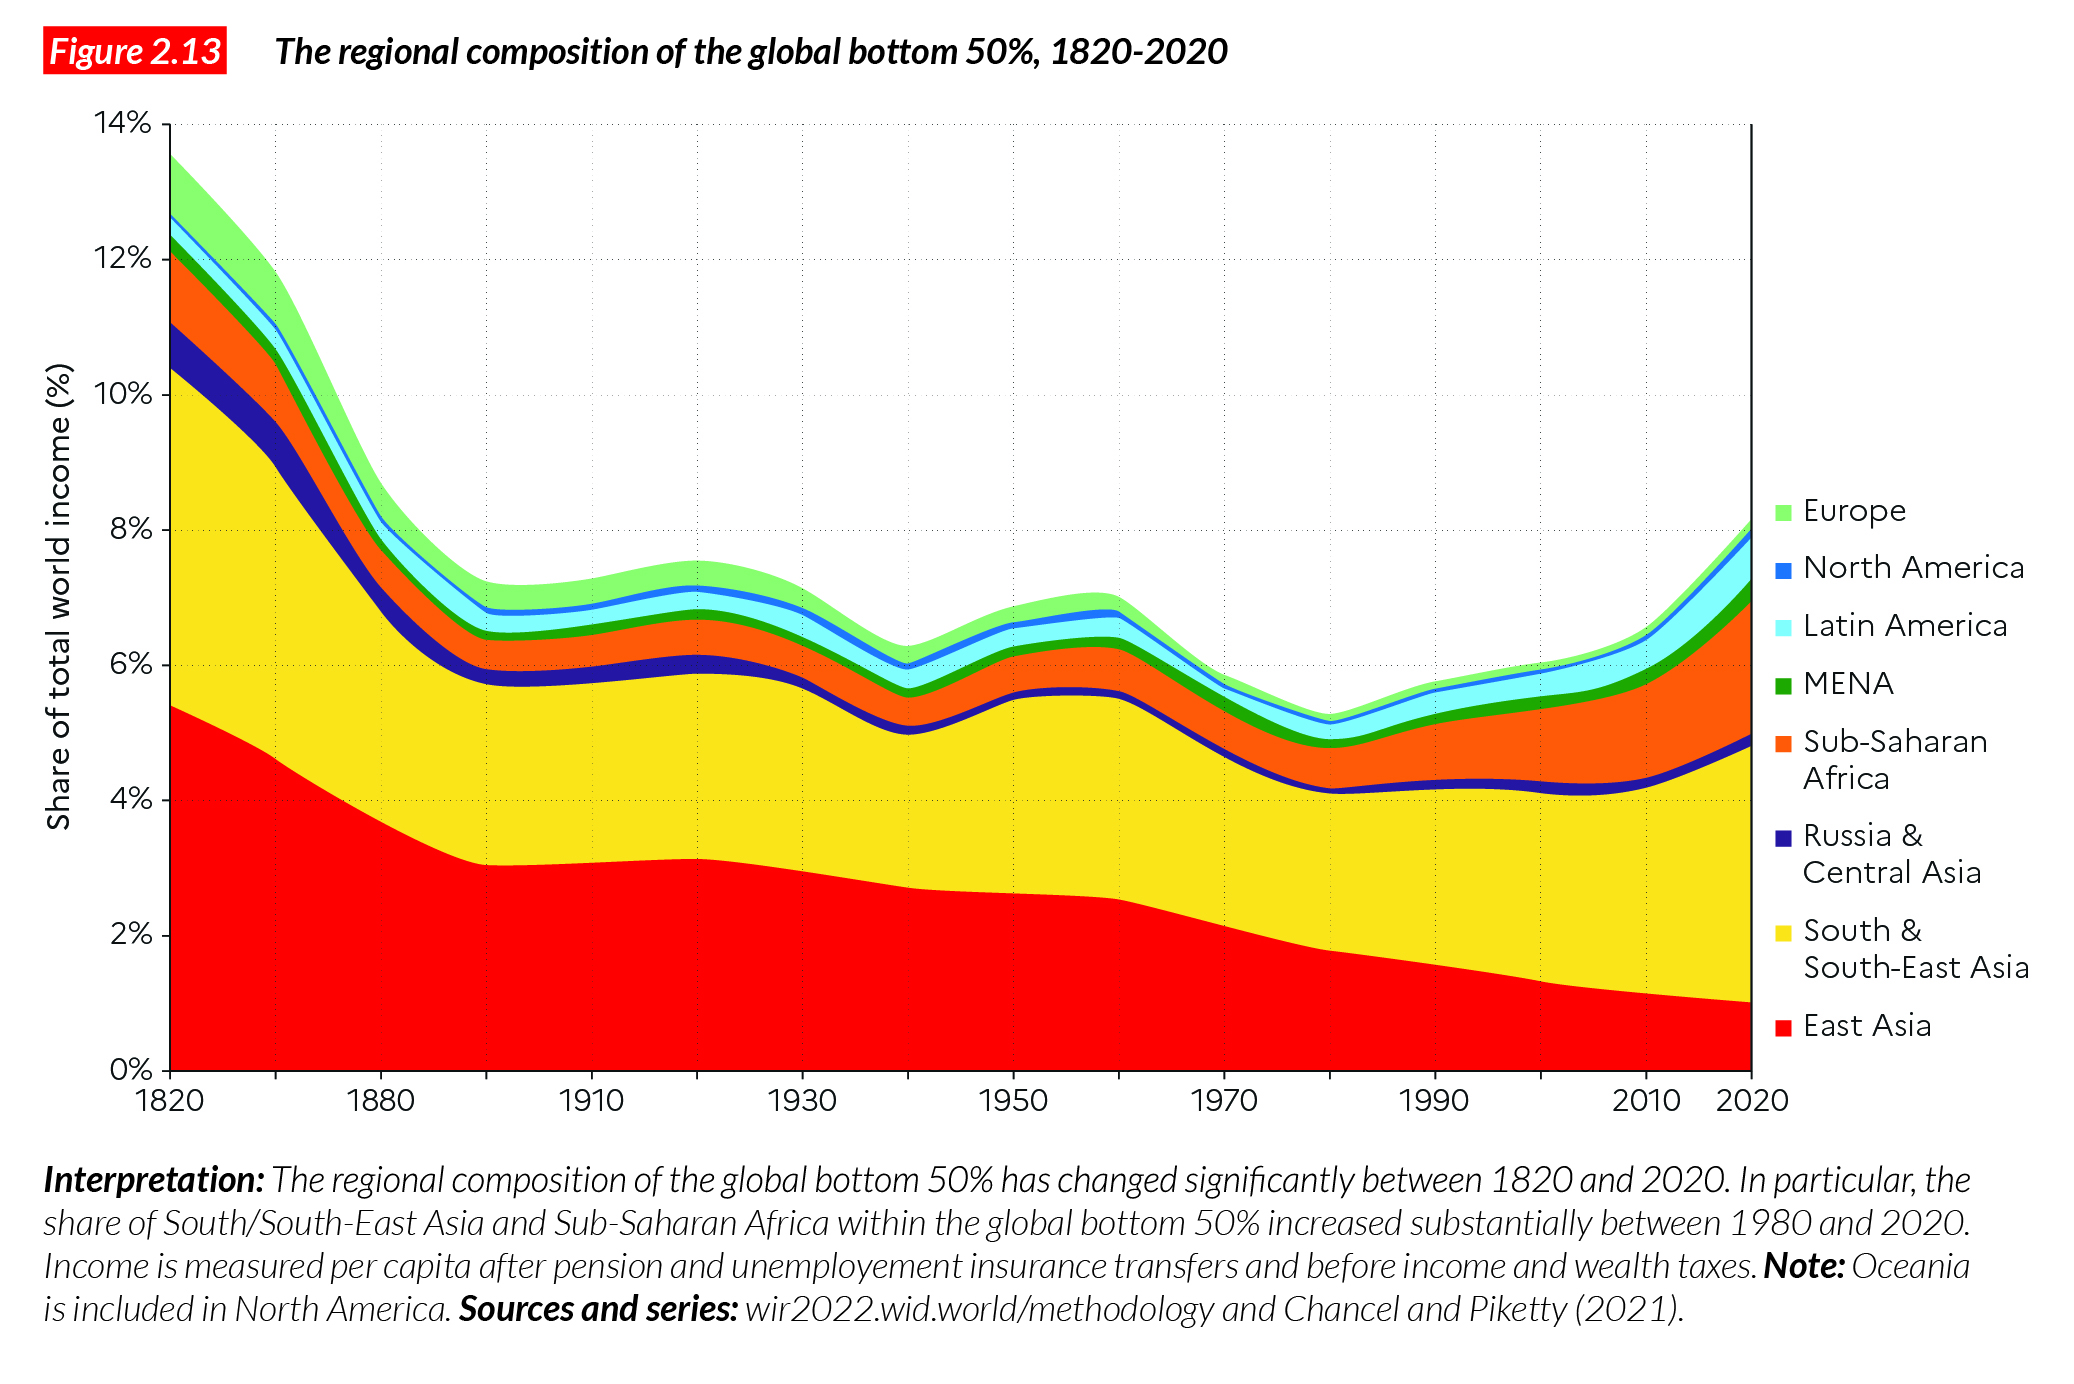
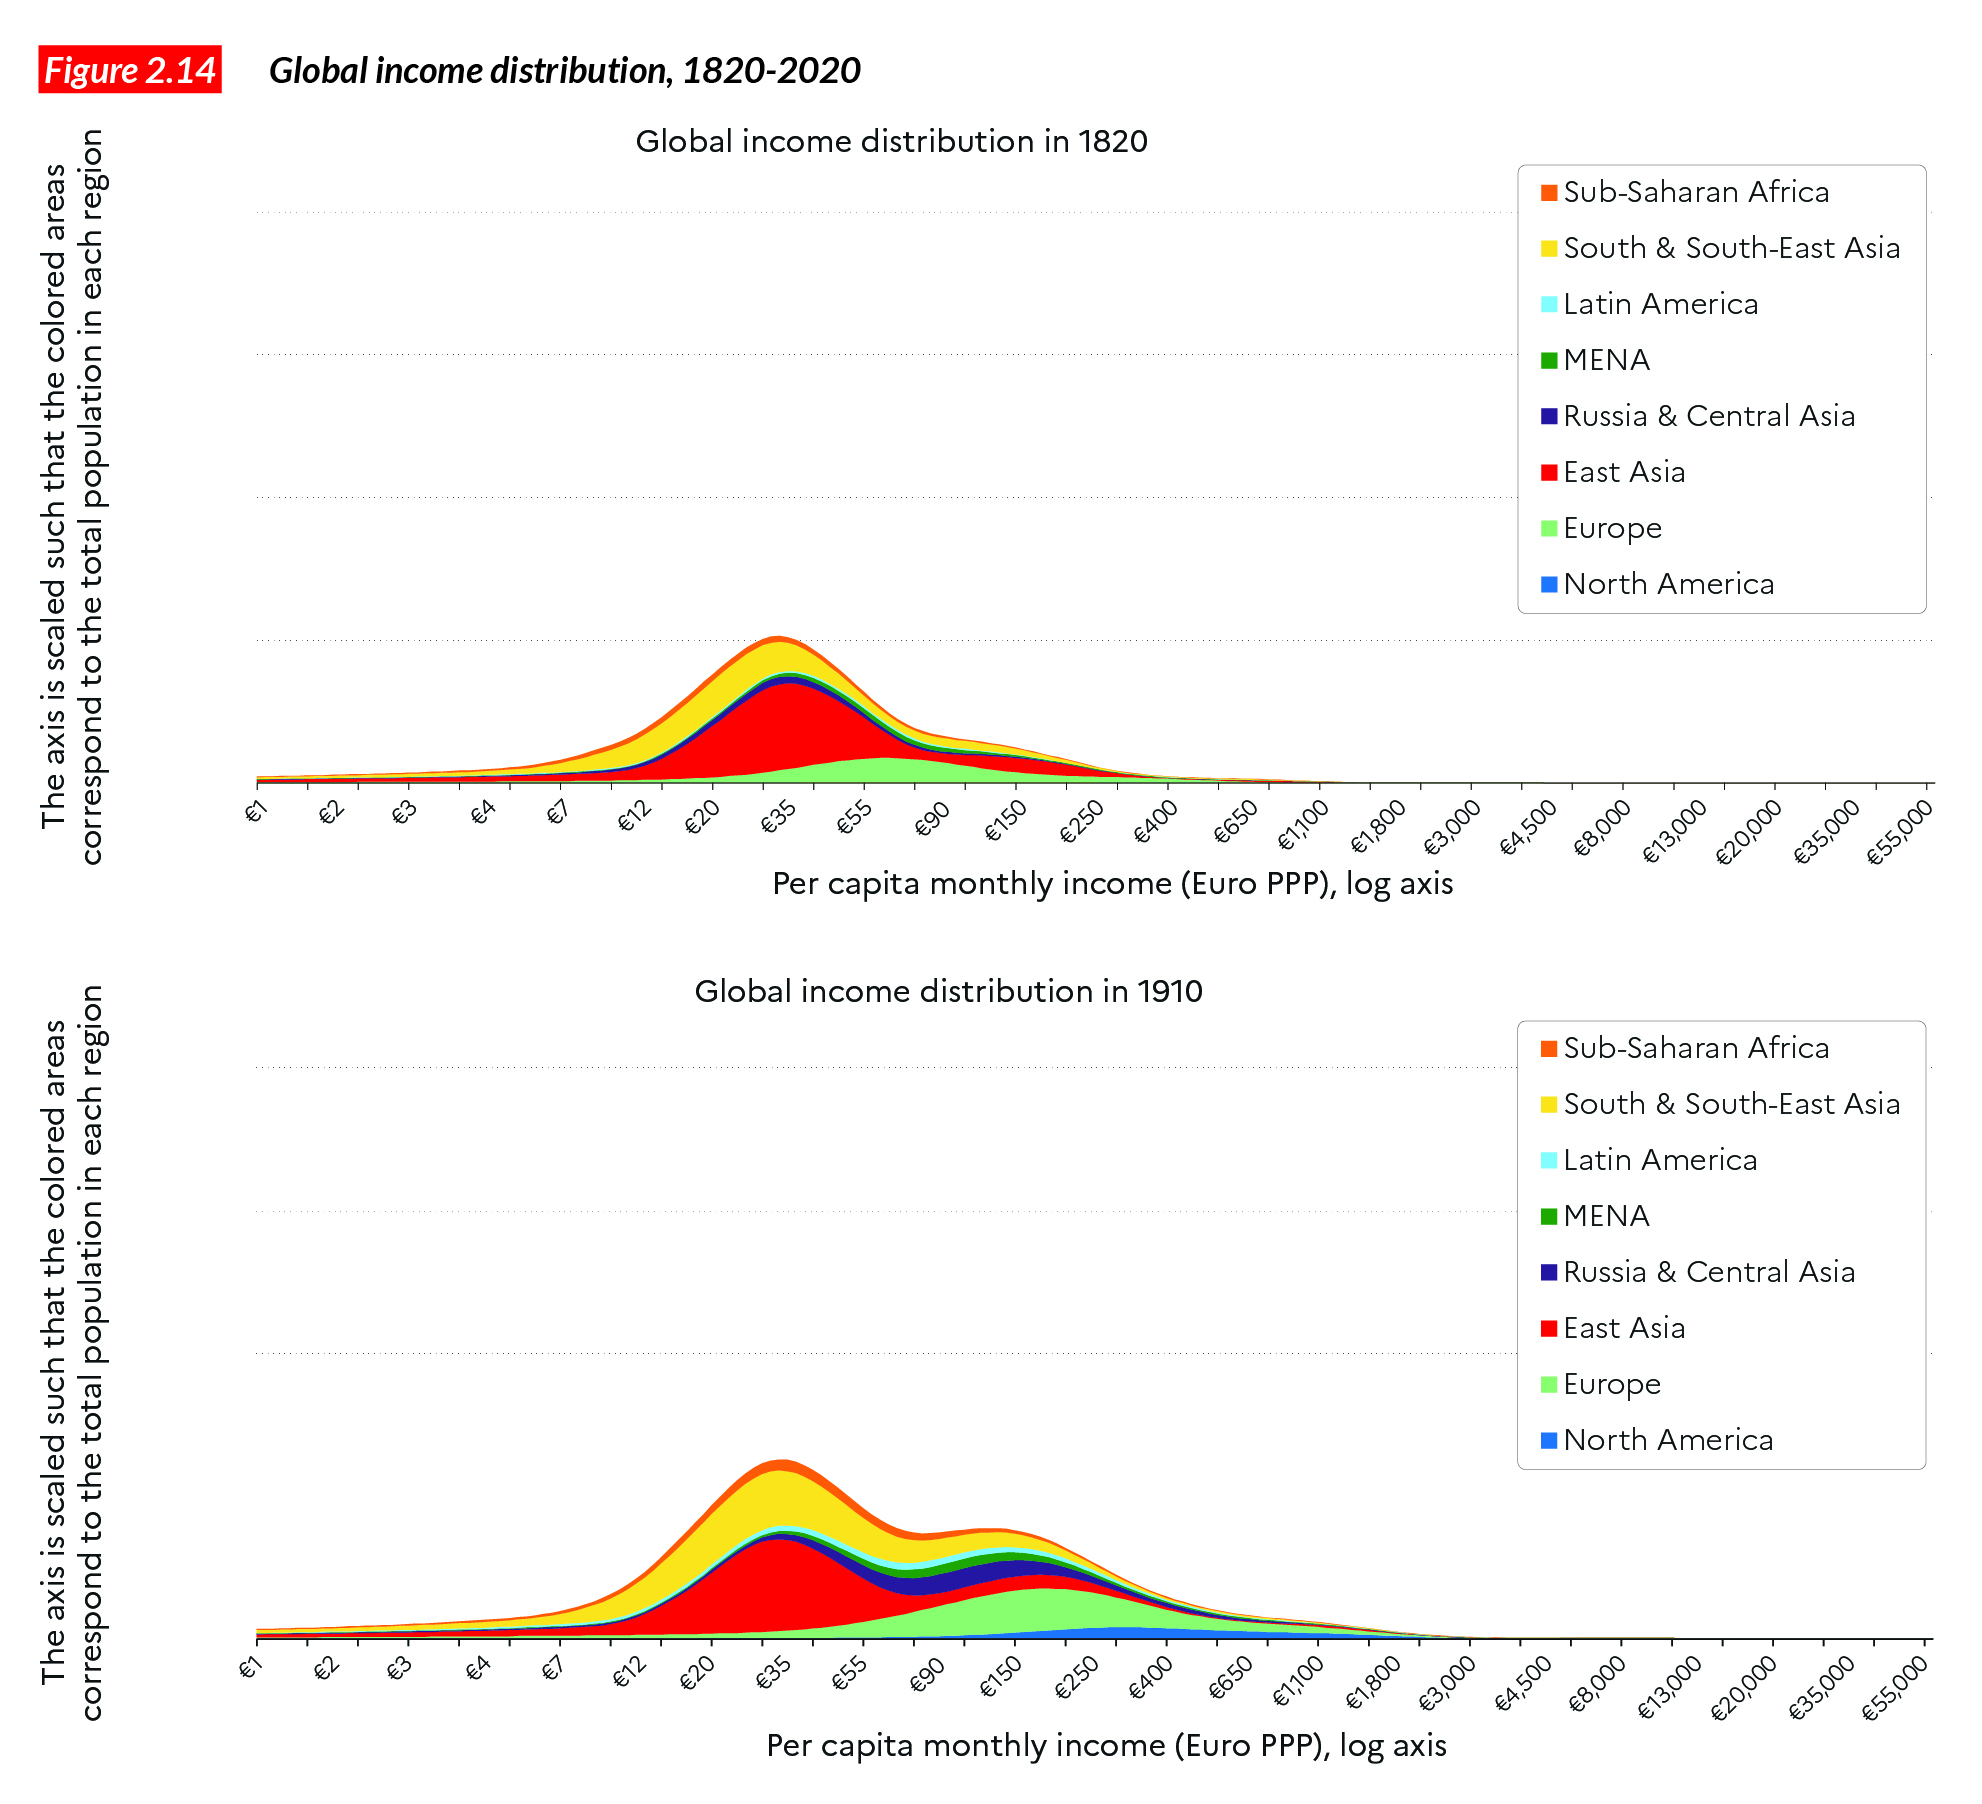
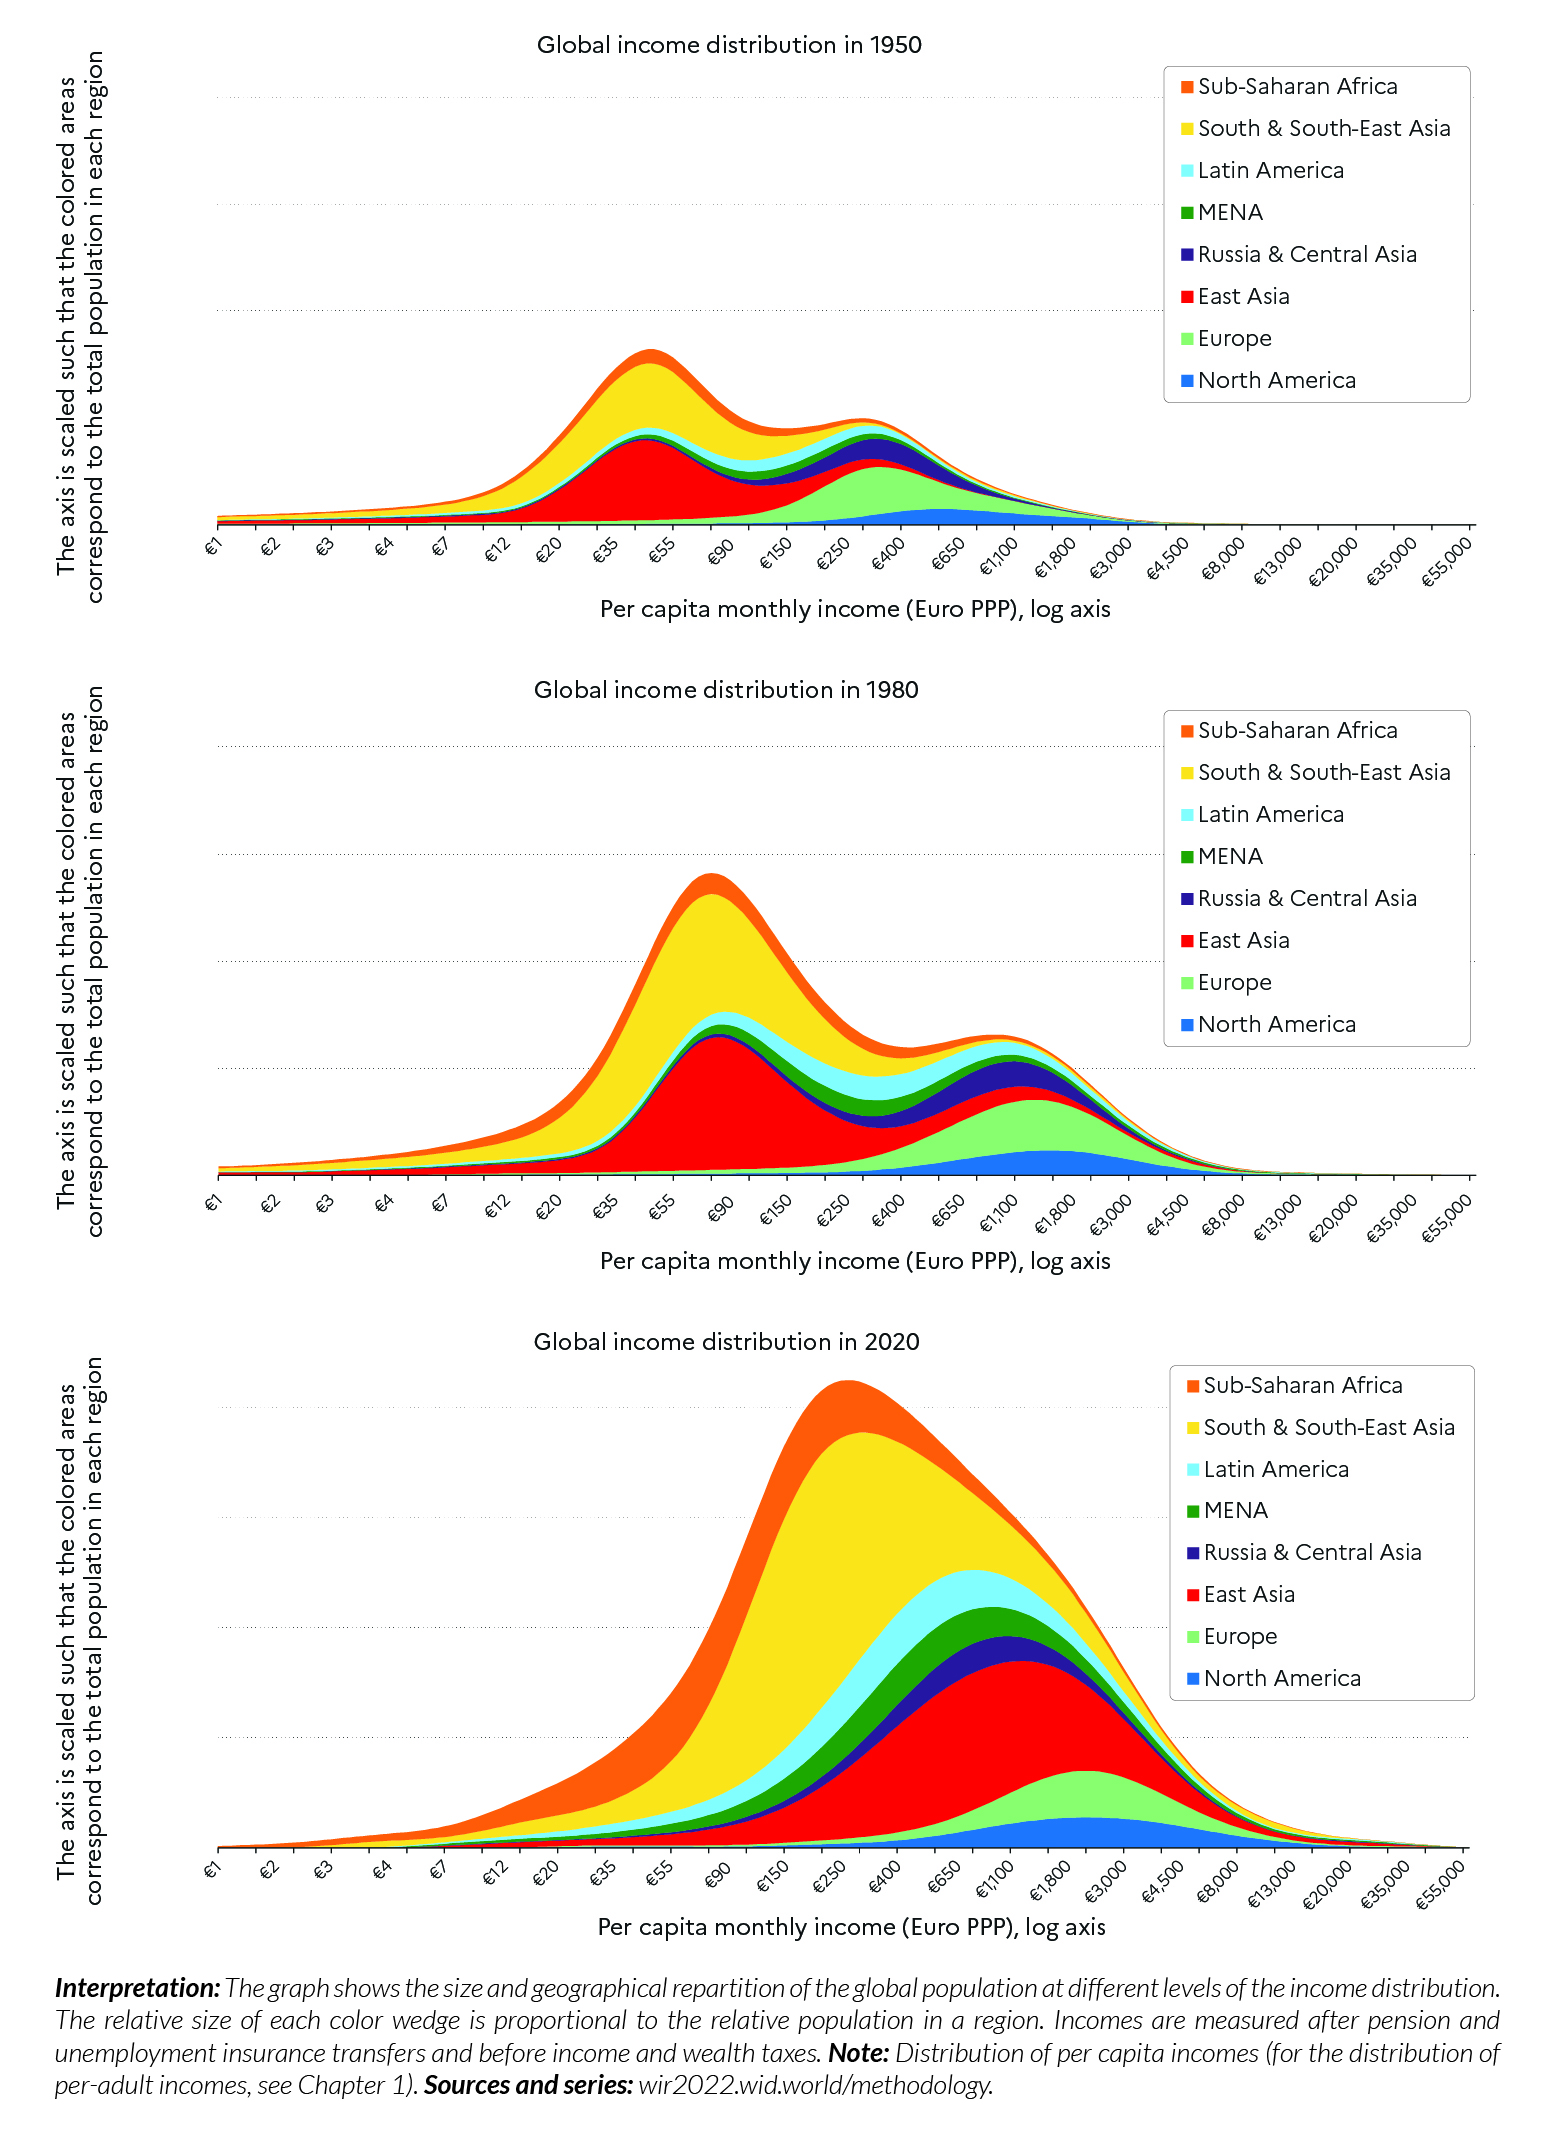
Figure 2.14 presents the relative size of the population across the global income distribution for the two centuries. Comparing the global income distribution between 1820 and 1910, we notice the rise of between- country inequality, where Sub-Saharan Africa, South and South-East Asia and East Asia occupy the bottom of the distribution and North Americans and Europeans occupy the top of the distribution.
Between-country inequality continued to rise until 1980 and started declining between 1980 and 2020. Over this period of time, we notice that the gap between regions narrows down as East Asia (mainly China) moves up along the global distribution and catches up with North America and Europe.
Taxes and transfers do not reduce global inequality that much
Our benchmark income concept is pre- tax, post-replacement national income, which in the framework of distributional national accounts refers to income before taxes and transfers, except for operations of the social insurance system (pensions and unemployment benefits), which in practice in most countries constitutes the largest component of redistribution. All series presented so far use this definition of income. We have also produced estimates using the concept of post-tax national income, wherein we deduct all taxes and add all transfers (including in-kind transfers and collective expenditures)4. These calculations involve a number of assumptions and should be viewed as exploratory and incomplete. Our main finding is described in Figure 2.15. The bottom line is that taxes and transfers (other than pensions and unemployment benefits) have little impact on 1820-1910 series and a limited impact on 1910-2020 series. In particular, whether we look at pre- tax, post-replacement national income or at post-tax national income, we find that the level of global inequality in 2020 is close to the level observed around 1880-1900. The results for within and between country inequality trends and regional decomposition are virtually unchanged.
Understanding the roots of global economic inequality: Center and periphery imbalances
How do we account for the rise of global inequality between 1820 and 1910, and for the persistence of high levels of global inequality between 1910 and 2020, and what are the lessons for the future? Put briefly, our main conclusion is that political and institutional factors, and the ideological strife between competing state powers and social classes have played major roles in past shifts and that this is also likely to be so in the future.
We should first stress that people in countries with relatively low average incomes also tend to work longer hours, both in the cross- section and over time, so that the global inequality of hourly income is even higher than the global inequality of income and has followed the same evolution over the long run (in an even more pronounced manner)5. From the viewpoint of standard neoclassical economics, the most obvious explanation for the extreme and persistent inequality in hourly income (productivity) is the inequality in capital endowments. That is, if the poorest economic groups at the global level were to receive sufficient capital investment, both in terms of physical capital (equipment, machinery, infrastructure, etc.) and human capital (education, skills, health, etc.), then global income inequality would shrink tremendously. At some level, this must be right. If there were sufficient redistribution of wealth from the richest global economic groups to the poorest, allowing for massive investment in physical and human capital benefiting the world’s poorest groups, then global inequality would certainly shrink. However, there are obvious reasons of political economy why this is unlikely to take place in the form of a simple wealth transfer.
Unless they are forced to, through revolution, land reform or permanent systems of progressive taxation and redistribution of wealth, the richest economic groups are unlikely to give away their assets. They will, rather, attempt to lend resources and earn the highest possible returns out of their capital investment. This has several consequences. First, the fact that the poorest are borrowers who need to repay large sums, rather than asset owners, implies that they have less economic autonomy and fewer incentives to produce. Next, because lenders fear expropriation (and often rightly so), they will tend to regulate their relationships with the poorest groups through colonial and military domination, and to organize investment patterns so as to keep control of the most valuable production processes.
There is ample evidence that “center– periphery” relations developed between 1800 and 1950 with the establishment of Western dominance and colonial empires, and that this process largely explains the extraordinary rise of between-country inequalities in this period. In particular, Kenneth Pomeranz has shown the extent to which the Industrial Revolution of the late 18th and 19th century, first in Britain and then in the rest of Europe, depended on large- scale extraction of raw materials (especially cotton) and energy (especially in the form of wood) from the rest of the world – extraction that was achieved through coercive colonial occupation6. In Pomeranz’s view, the more advanced parts of China and Japan had attained a level of development in the period 1750-1800 more or less comparable to certain regions of Western Europe. Specifically, we find similar forms of economic development, based in part on demographic growth and intensive agriculture (made possible by improved agricultural techniques and a considerable increase in cultivated acres thanks to land clearing and deforestation); we also find comparable processes of proto- industrialization, particularly in the textile industry. Two key factors caused European and Asian trajectories to diverge. First, European deforestation, coupled with the presence of readily available coal deposits, especially in England, led Europe to switch quite rapidly to sources of energy other than wood, and to develop corresponding technologies. Furthermore, the fiscal and military capacity of European states, largely a product of their past rivalries, and reinforced by technological and financial innovations stemming from interstate competition, enabled them to organize the international division of labor and supply chains in particularly profitable ways. The exploitation of land in North America, the West Indies, and South America, using slave labor brought from Africa, produced the raw material that not only earned handsome profits for the colonizers but also fed the textile factories that developed rapidly in the period 1750- 1800. Military control of long-distance shipping routes allowed the development of large-scale complementarities. By 1830, British imports of cotton, wood, and sugar required the exploitation of more than 10 million hectares of cultivable land, according to Pomeranz’s calculation, or 1.5-2 times all the cultivable land available in the UK. If the colonies had not made it possible to circumvent the ecological constraint, Europe would have had to find other sources of supply. We are, of course, free to imagine scenarios of historical and technological development that would have enabled an autarkic Europe to achieve a similar level of industrial prosperity, but it would take considerable imagination to envision fertile cotton plantations in Lancashire and soaring oaks springing from the soil outside Manchester. In any case, this would be the history of another world, having little to do with the one we live in.
Subsequent work has largely confirmed the central role of military and colonial domination in accounting for the rise of global inequality during the 19th century. Sven Beckert’s work on the “empire of cotton” has shown the crucial importance of slave extraction and cotton production for the seizure of control of the global textile industry by the British and other Europeans. Half of the African slaves shipped across the Atlantic between 1492 and 1882 sailed in the period 1780-1860 (especially 1780-1820)7. This late phase of accelerated growth in the slave trade and cotton plantations was key to the rise of the British textile industry. The natural reproduction of slaves also played a major role, particularly on US soil, where the number of slaves quadrupled between 1800 and 1860, and the production of cotton was multiplied by 10. On the eve of the American Civil War, 75 percent of the cotton imported by European textile factories came from the southern United States. Prasannan Parthasarathi also emphasizes the role played by anti-India protectionist policies in the emergence of the British textile industry in the 18th and early 19th centuries8. It was only after acquiring a clear comparative advantage in textiles that the UK began in the mid-19th century to adopt a more full- throated free trade rhetoric (though not without ambiguities, as in the case of opium exports to China). The British also relied on protectionist measures in the shipbuilding industry, which was flourishing in India in the 17th and 18th centuries. According to available estimates, the Chinese and Indian share of global manufacturing output, which was still 53 percent in 1800, had fallen to five percent by 1900, largely as a consequence of military and colonial coercion9.
Between 1820 and 1910, at the same time as global between-country inequality was rising at an accelerated pace, within-countries inequality was also very high and rising slowly (see Figure 2.4). We have to wait until the World War I to see the beginning of a significant decline of income and wealth inequality within Western countries and in other parts of the world. That within- country inequalities remained so high until 1910-1920 can be accounted for by a mixture of ideological and institutional factors. In a country like Sweden, for instance, the electoral system that applied between 1865 and 1910 was the embodiment of proprietary ideology: only the top 20% (male) property owners had voting rights, and within this group, each person was granted between one and 100 votes, depending on the size of his fyrkar (a formula based upon asset ownership, income and tax payments). A few decades later, the entire system had been turned upside down: universal suffrage was introduced, the Social Democrats took power in 1932 and put the state’s capacities at the service of a completely different political project, based on socioeconomic equality10. More generally, the large decline in within-countries inequalities that took place between 1910 and 1980 was the consequence of large-scale political mobilization and institutional change. In little more than 30 years (1914-1945), the balance of power between capital and labor was considerably transformed, thanks to worker mobilization as well to the combined impact of World Wars I and II, the Great Depression and a number of revolutionary events (including the Russian Revolution of October 1917). Various coalitions of social democrats, labor parties, democrats, socialists and communists took power in a great many countries, and implemented combinations of redistributive policies, manifest in the building of the welfare state and policies of progressive taxation on income and wealth. The expansive and inclusive investments in public infrastructure, education and health that followed contributed not only to a sharp reduction in inequalities but also to increased growth and prosperity in post-war Western countries11.
The political shocks that occurred between 1914 and 1945 also contributed to the end of colonial empires and to Western dominance, but with substantial delays. In a first step, Europe’s colonial expansion reached its peak between 1910 and 1950, especially the British and French Empires, which inherited the remains of the Ottoman Empire and the German colonies in 1919-1920. In the longer run, World Wars I and II strongly contributed to the weakening of European state powers, the development of strong independence movements, and finally to the end of European colonialism in 1950s-1960s. Between 1950 and 1980, North–South inequality continued to rise, first because it was a period of exceptionally rapid growth in the North, and next because it took a few decades for the newly independent countries to emerge from independence wars and civil unrest, and to design suitable development strategies, which then led in some cases to the reduction of between- country inequalities between 1980 and 2020 (as illustrated for instance by the cases of China and Vietnam). within-country inequalities started to rise again globally around 1980-1990, following the demise of state-led socialism in China and Russia, and the conservative revolution in the West (leading to serious reductions in progressive taxation, union power, and minimum wages, and an historical interruption in the rise of the social state). After the 2008 financial crisis, neoliberal policies became less and less attractive, and between-country inequality seems to have reached a plateau. It is too early to tell whether the 2020 pandemic and the growing awareness of the environmental crisis will lead to a new wave of state interventions and inequality reduction in the future.
Global inequality within countries is higher than inequality between countries – which remains significant
On the matter of inequality among world citizens, our findings offer a novel perspective on the relative importance of within- and between-country inequalities. Francois Bourguignon and Christian Morrisson recently found that most global inequality was explained by between-country differentials over the 1950-1990 period12. This finding was also supported by Christoph Lakner and Branko Milanovic, who extended Bourguignon and Morrisson’s series up to the early 2010s13. Our new series reveal that, around the turn of the 21st century, the within- country component of global inequality has become greater than the between-country component14. In contemporary capitalism, an individual’s income group (i.e. whether they belong to the bottom 50%, top 1%, etc. in their own country) now matters more than their nationality (where they live) in the determination of global inequality levels. The basic implication of this finding is that the pre-distribution and redistribution of incomes and capital within countries, both rich and emerging, is essential to reducing global inequality. We should stress, however, that inequality between countries is still very high in absolute terms in 2020 (roughly at the same level as in 1900), and that reducing average income (or capital endowment) differences between countries still matters significantly. Put differently, within-countries inequalities now dominate in relative terms, but disparities between countries are still very great, which explains why overall inequalities are so marked, in a way that is comparable to the situation in 1900-1910. In addition, while between-country inequality has been declining since 2008, there is no guarantee at all that it will keep declining in the future.
In the European colonial empire period, the world economic system was explicitly organized in a highly hierarchical manner, and the reproduction of inequality directly derived from there. For instance, in French Algeria, until 1962, expenditure on education for the children of Muslim Algerians was on average 40 times less than expenditure on the children of European settlers15. This specific type of political structure is now gone, but that does not mean that extreme inequalities in education expenditures and other capital investments have disappeared. In particular, center–periphery relations are still alive and well in the sense that dominant economic state powers, whether they are European, North American, Japanese or Chinese, tend to organize the international division of labor in a way that best suits their interests, and which often involves selective state protection and support for the production sectors that they view as crucial to their national interest and development strategy16. Periphery countries and weaker states, especially in Sub-Saharan Africa and South Asia, tend to be relegated to less productive activities, requiring less equipment and human capital, so, for example, they can obtain loans for certain types of capital investment but not others. Although this kind of neo-colonialism takes different institutional forms from those of classic colonialism, we can imagine circumstances in which this would lead to a stabilization of between-country inequality at a high level. Indeed, this will happen if it fits the interests and world views of the dominant states, and if periphery countries are not powerful enough to obtain the capital investments needed to improve their positions.
When he was writing in the 1980s, prominent historian and theorist of comparative development and core–periphery relations Immanuel Wallerstein famously hypothesized that the relative position of the world’s bottom 50% individuals might have deteriorated continuously between 1500 and 1980, thereby demonstrating the validity of Marxist predictions about increasing polarization under capitalism at the global level17. Things look somewhat different from the viewpoint of 2020, but not completely different: between-country inequality declined sharply between 1980 and 2020, but it is still much greater in 2020 than it was in 1820. Whether the trend toward more global equality will continue depends on several political, social and economic factors. Between 1910 and 1980, the march toward more within-country equality was led by socialist political movements that were also pushing to some extent for more equality at the international level, at least through their support for independence and an end to colonialism. New forms of internationalist egalitarian political mobilization around alternative economic system, and grassroots movements like Black Lives Matter, Fridays for Future and MeToo might play a similar role in the future. Novel challenges like climatic disasters, migration pressures and competition among China, Europe and the US might also trigger major political, ideological and institutional change. What seems fairly clear, however, is that an accelerated compression of inequality among and within countries will require a massive redistribution of wealth. For instance, we could think of allocating a fraction of global tax revenues paid by multinationals and billionaires to countries on the basis of their population. In the Sub-Saharan African and South Asian regions, this would radically transform the capacity of national states to finance investment in human capital, equipment and infrastructure18. Short of that, historical evidence suggest that extreme levels of global inequality can be highly persistent.
Box 2.1 Global inequality: beyond income measures
The series presented in this chapter are exploratory in many ways. First, we need more refined country studies on income inequality trends, both from a long-term perspective and for recent changes. In particular, access to adequate tax data is very constricted in large parts of the world, so in a number of regions our corrections to raw survey data often rely on a limited set of countries in which we have access to more diverse data sources (household surveys, tax data, inheritance and wealth records, national accounts). As better country series become available, we will refine our estimates of global inequality dynamics. The many robustness checks that we have performed demonstrate that this will not affect our general conclusions regarding the long-term shifts in global inequality. But it certainly might effect some of the finer breakdowns for the more recent period, and allow us to understand better the mechanisms behind global inequality trends.
Second, a deeper understanding of the transformation of global inequalities will also require detailed breakdowns by production sector. For instance, we emphasize the key role of the power structure of the global textile sector (Beckert’s empire of cotton) in order to understand changing power structures and core–periphery relations in the 19th century. It would be equally instructive to look more closely at the changing global dominance structure of the automobile sector in the 20th century, or the high-tech digital sector in the early 21st century. In relation to this perspective on global production systems, it is also crucial to analyze the evolution of the structures of energy extraction and consumption, carbon emissions and environmental damage19. This material perspective on global inequality is highly complementary to the income perspective adopted in this paper. Indeed, factoring in environmental pollution may reinforce the level of global inequality between countries in 2020 (as the effects of climate change are more pronounced in low-income countries) as well as within countries (as low-income groups also tend to be disproportionately impacted by environmental damages)20.
Finally, the global income inequality perspective ought to be supplemented by a global wealth inequality perspective. We already know from previous research that private wealth-to-income ratios have increased enormously in recent decades and are now close to their early 20th century peak (around 500-600% of national income by 2020, compared with about 300% of national income in the 1970s, and about 600% of national income in 1910)21. On the eve of World War I, net foreign wealth held by British property owners was as much as 200% of national income. It was over 100% of national income for their French counterparts. A very large share of top incomes around 1910 was made of capital income flows coming from colonial assets and other foreign investment. In other words, the between-country inequality structure and the within-country inequality structure were tightly intertwined at the time of colonial empires22. Net foreign assets held by China, Germany and Japan increased significantly over the 1990-2020 period, but they remain more modest than those held by Britain and France in 1910 relative to GDP23. One major difference, however, is that gross foreign positions have reached much higher levels in our era of financial globalization than in any previous era. We should look more closely at gross positions in different production sectors (and not only at aggregate net foreign wealth), e.g. Chinese or Western investment patterns in construction, transportation, and mining in various African and Asian countries, in order to analyze properly the dynamics of ownership and power structures in the recent period. More research is needed on global wealth dynamics if we are to reach a better understanding of global inequality trends24.
1 All our benchmark series are based on income per capita values. For additional series, see our online data sets. Focusing on income per adult, we find a global bottom 50% income share slightly above 8% today. The difference is due to the fact that low-income countries have relatively fewer adults than rich countries. This contributes to (a slight) increase in the global bottom 50% income per adult share compared with per capita values. We prefer per capita values as benchmark series to be consistent with Maddison’s population data.
2 Technically, one advantage of using the Theil index is that it allows for additive decompositions, i.e. the global Theil index is exactly equal to the sum of the within-country Theil index and the between-country Theil index (which is not the case with other inequality indexes such as the T10/B50 income gap or the Gini coefficient). However, we prefer to focus attention on inequality indicators based on income ratios because these are more intuitive and easier to grasp. All substantial conclusions that we present in this paper hold, independent of the specific inequality indicator.
3 For a more detailed discussion, see Alvaredo, F., L. Chancel, T. Piketty, E. Saez, G. Zucman. 2018. World Inequality Report 2018, Cambridge: Harvard University Press.
4 See Blanchet, T., L. Chancel et al. 2021. “Distributional National Accounts Guidelines. Methods and Concepts Used in the World Inequality Database”. World Inequality Lab.
5 See A. Ahmed 2021. “Global Inequality of Hourly Income”, 1980-2020, Paris School of Economics, Master Thesis.
6 Pomeranz, K. 2000. The Great Divergence: China, Europe and the Making of the Modern World Economy. Princeton: Princeton University Press, 2000.
7 Beckert, S. 2015. Empire of Cotton: A Global History. New York: Vintage.
8Parthasarathi, P. 2011. Why Europe Grew Rich and Asia Did Not: Global Economic Divergence, 1600-1850. Cambridge: Cambridge University Press.
9 Note that the role of slave and colonial extraction in the development of industrial capitalism had already been analyzed by numerous 19th century observers (beginning with Karl Marx), and by Eric Williams (prime minister of Trinidad from 1956 to 1981) in Capitalism and Slavery (1944). By contrast, Max Weber, in The Protestant Ethic and the Spirit of Capitalism (1905), stressed cultural and religious factors, whereas Fernand Braudel in Civilisation matérielle, économie et capitalisme (1979) focused on the role of high finance in both Catholic and Protestant Europe. The recent work of Pomeranz, Parthasarathi, and Beckert is much less Eurocentric; to some extent it represents a return to Marx and Williams, but with the richer tools and sources associated with global and connected history.
10 See Bengtsson E., A. Missiaia, M. Olssson, and P. Svensson.2017. “Wealth Inequality in Sweden, 1750-1900”, Economic History Review.
11 See Piketty T. 2014. Capital in the 21st century, Cambridge: Harvard University Press; Piketty T. 2020. Capital and ideology, Cambridge: Harvard University Press; See also Lindert. P. 2004. Growing Public. Social Spending and Economic Growth since the 18th Century, Cambridge: Cambridge University Press.
12 Bourguignon, F. and C. Morrisson. 2002. “Inequality among World Citizens: 1820-1992.” The American Economic Review, vol. 92 (4): 727-744.
13 Lakner, C., and B. Milanovic. 2016. Global Income Distribution: From the Fall of the Berlin Wall to the Great Recession. Published by Oxford University Press on behalf of the World Bank. https://openknowledge.worldbank.org/handle/10986/29118 License: CC BY-NC-ND 3.0 IGO.
14 The main difference from earlier series is the use of historical tax data, more precise than household surveys used in earlier long-run studies of global inequality. For an overview of our methodology, see Section 2, the online appendix as well as Blanchet T., L. Chancel et al. “Distributional National Accounts Guidelines” that provides a detailed description of the various sources used.
15 Cogneau, D., Y. Dupraz, S. Mesplé-Somps, « Fiscal Capacity and Dualism in Colonial States: The French Empire 1830-1962 », Journal of Economic History, 2021; See Piketty, T. 2019. Capital et idéologie. Paris: Seuil. Figure 7.8.
16 See Chang H.J. 2002. Kicking Away the Ladder: Development Strategy in Historical Perspective, Anthems. See Mazzucatto M. 2013. Entrepreneurial State: Debunking Public vs Private Sector Myths, Anthems.
17 See Wallerstein, I. 1974-1989. The Modern World-System, 3 volumes, Academic Press. See also Balibar, E. and I. Wallerstein. 1988. Race, nation, classe : les identités ambiguës. Paris: La Découverte, where Wallerstein hinted that the absolute position (and not only the relative position) of the world’s bottom 50% might also have deteriorated since the beginning of capitalism, while at the same time mentioning that the existence of communist and socialist alternatives led to some limited absolute progress in some cases.
18 See Piketty, T. Une brève histoire de l’égalité, Paris: Seuil, 2021 (A Brief history of equality, Cambridge: Harvard University Press, 2022)
19 See e.g. Chancel, L. 2020. Unsustainable inequalities. Cambridge: Harvard University Press.
20 See Diffenbaugh, N. S., and M. Burke. 2019. “Global Warming has Increased Global Economic Inequality.” Proceedings of the National Academy of Sciences, 116 (20): 201816020. https://www.researchgate.net/publication/332581715_Global_warming_has_increased_global_economic_inequality. See also Burke, M., S. M. Hsiang, and E. Miguel. 2015. “Global non-linear effect of temperature on economic production”, Nature, 527 (235–239); Hallegatte, S., and J. Rozenberg. 2017. ”Climate change through a poverty lens.” Nature Climate Change 7 (4): 250-256; Chancel, L. Unsustainable inequalities.
21 See Piketty, T., and G. Zucman. 2014. “Capital is Back: Wealth-Income Ratios in Rich Countries 1700-2010”, Quarterly Journal of Economics.
22 See Piketty, T., G. Postel-Vinay, and J-L. Rosenthal. 2006. “Wealth Concentration in a Developing Economy, Paris and France, 1807-1994.” American Economic Review, 236-256; and Piketty, T. 2019. Capital et idéologie. Paris: Seuil. Table 4.1.
23 See Piketty, T. 2019. Capital et idéologie. Paris: Seuil. Figure 7.9.
24 For a global perspective on wealth, see Chapter 4 of this report.
