
Female labor income share across the world, 1990-2020
“Gender inequalities remain considerable at the global level and progress within countries is too slow”
The World Inequality Report 2022 provides the first estimates of the gender inequality of global earnings. Overall, the share of women in total incomes from work (labour income) neared 30% in 1990 and reaches 34% today. Current gender inequalities in earnings remain very high: in a gender equal world, women would earn 50% of all labor incomes. In 30 years, progress has also been very slow at the global level. Indeed, dynamics have been different across countries, with some recording progress and others with a reduction in the share of female earnings.
This chapter is based on “Half the sky? The Female Labor Income Share in a Global Perspective”, by T. Neef and A.-S. Robilliard1.
The previous chapters of this report focus on the inequality between income and wealth groups, between and within countries. So far, we have not looked at a major dimension of socio-economic inequality – gender. There are many ways to look at gender inequality. Under the umbrella term Gender Economics, a large literature on patterns of gender inequality and its causes has emerged. One key concept developed in this literature is the gender pay gap, as measured by the average gap between men’s and women’s wages and salaries, before or after controlling for the type of work, the level of qualification or other factors. The unadjusted gender pay gap is the overall gap in remuneration between men and women, while the adjusted gender pay gap controls for differences in education, experience and occupation and thus only compares the pay of men and women with similar observable labor market characteristics.
Certain gender inequality measures have been quite well disseminated in the media over the past years. For instance, activist groups and institutions celebrate “Equal Pay Day” in several countries. This day symbolizes how far into the year the average woman would have to work in order to earn what the average man earned over the previous calendar year. The exact date therefore varies from country to country because the date is typically set based on the gender pay gap measures before controlling for qualifications or occupation: in the US, Equal Pay Day was celebrated on March 24 in 2021 (because the value of the gap is found to be 18% on average).
These metrics play an important role in informing us about the persistence of large income gender inequalities in both high- and low-income countries. We believe, however, that these analyses should be complemented with other types of indicators which can shed light on broader structural inequalities between women and men but are not fully captured by pay differentials. In fact, gender pay gaps generally do not consider inequalities in employment level. Women continue to have less access to the labor market (and especially to the most rewarding occupations) in many countries and this exacerbates the gender inequality in total earnings. For a clear understanding of where societies stand in terms of gender inequality at work, the relative overall shares of labor income accruing to women and men stands out as an essential indicator, but it has so far been overlooked. We see it as the best metric to consider gender income inequality from a systemic perspective.
The aim of this chapter is therefore to address the following questions: how big is the share of total labor income earned by women across the globe? (The detailed methodology and full set of results are available in Neef and Robilliard’s study.)2 How has women’s share of labor income evolved since the 1990s? And how prominent is the under- representation of women at the top of the labor income distribution? Our main income concept, labor income, comprises wage and salaries as well as the labor share of self- employment income. We assume the latter to be 70% of full self-employment income. The female share of total labor income is the national aggregate labor income earned by women relative to the total aggregate of labor income within a country.
The data presented below, collected, harmonized and analyzed by Theresa Neef and Anne-Sophie Robilliard is, to our knowledge, the first data set on female labor income shares covering 180 countries since 1990 (see Box 5.1 on Methodology).
Female labor income share across the world today: regional divides
Figure 5.1 presents a world map of female income shares in 2019 based on the World Inequality Lab’s modeled estimates. In a country with perfect equality between women and men, the female labor income share would be equal to 50% (though at the global level, there are very slightly more men than women and the ratio is 50.4%). In practice, we find that the female labor income share is systematically below 50%, with significant variations across countries, ranging from below 10% to 45%.
The former Eastern Bloc is where female labor income shares are the highest, with the average female share near 41%, with values typically ranging around 38-43%. The lowest level is found in Bosnia Herzegovina (34%) and the highest in Moldova (45%). In 15 countries, the share is above the 40% line. In the Russian Federation, the female labor income share stands at 40%.
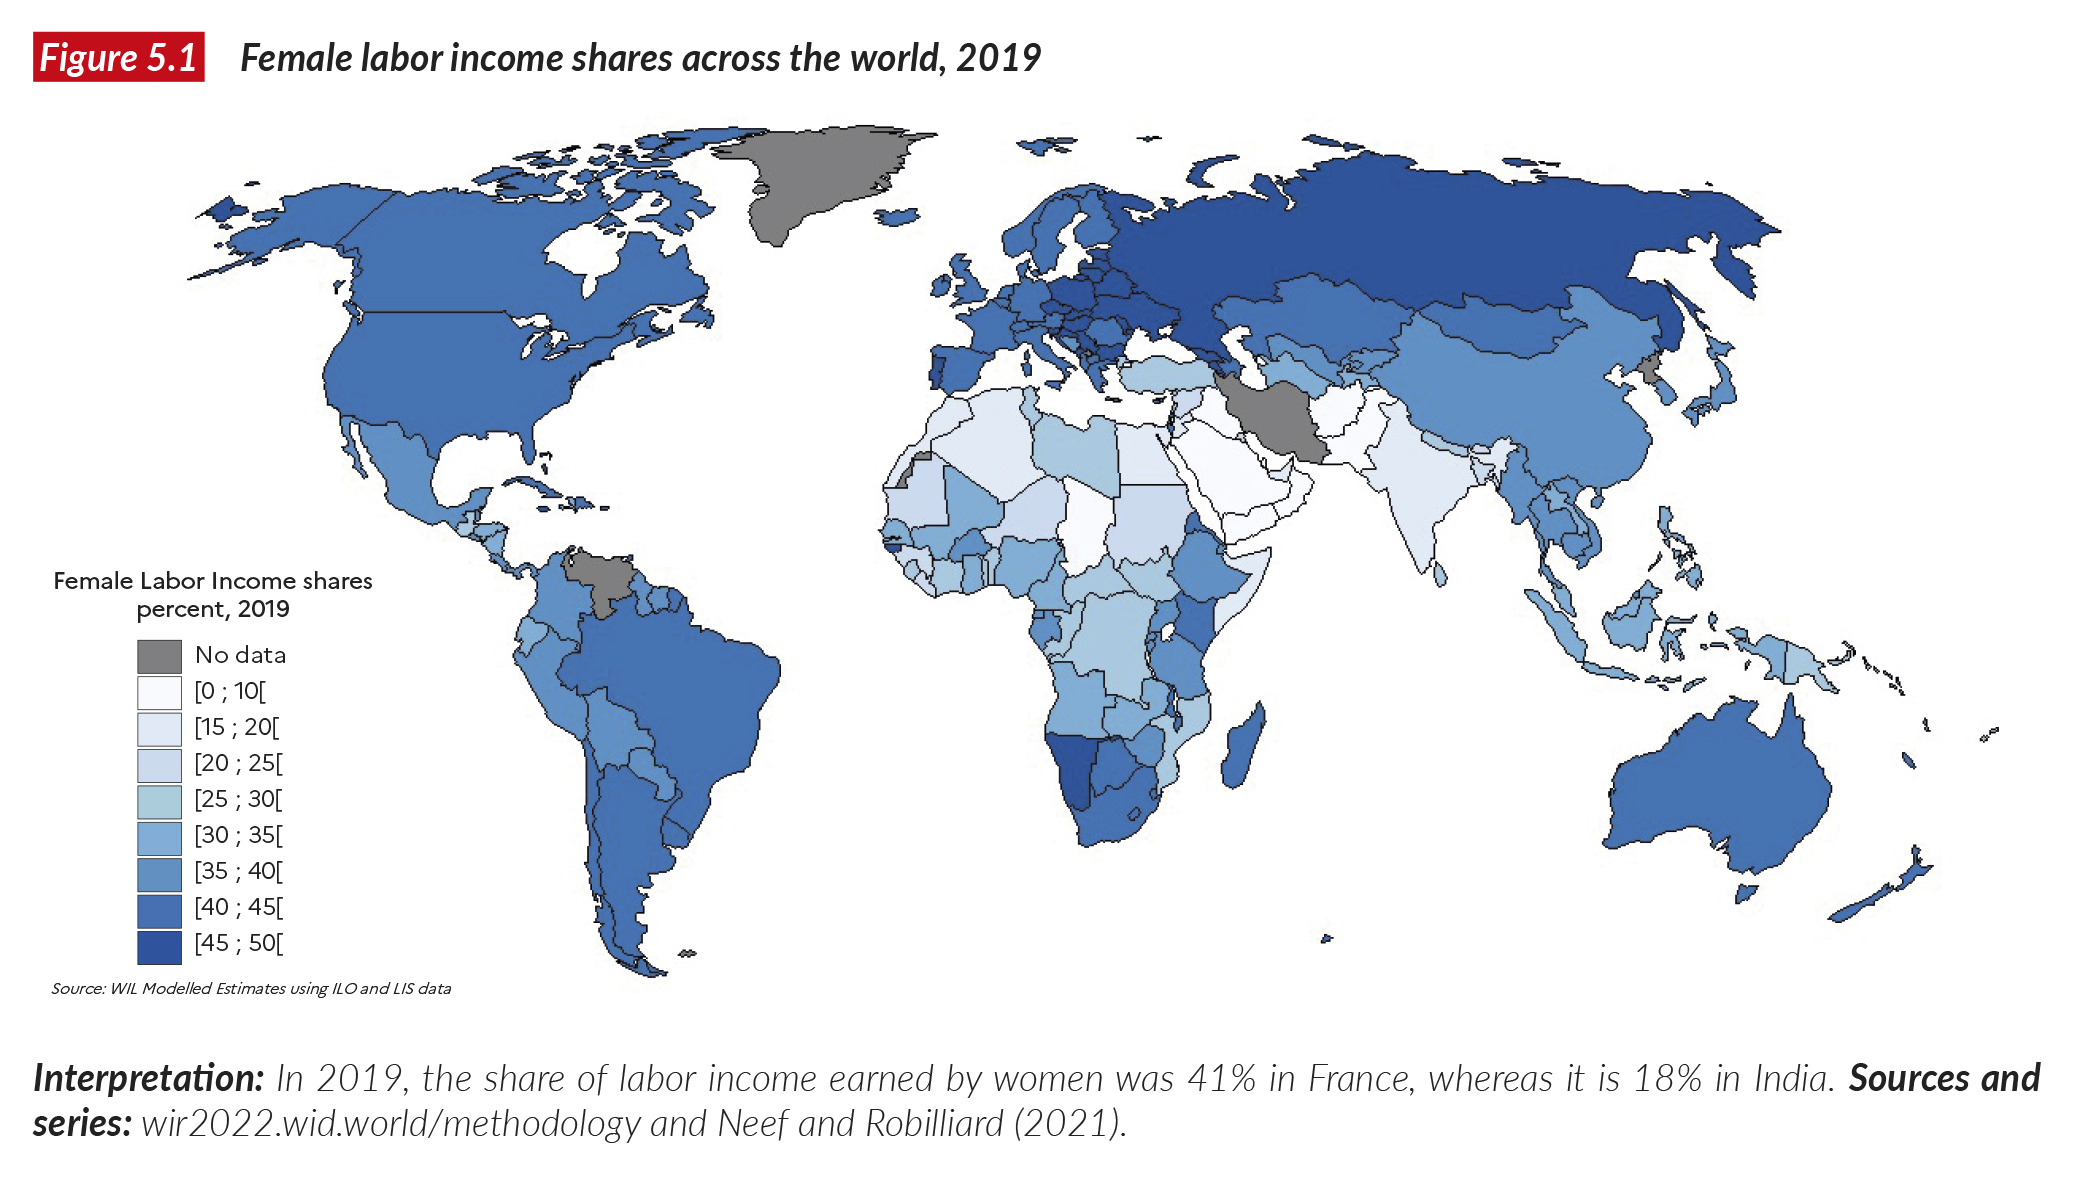
Western Europe is found to have high labor income shares in comparison with other parts of the world; the average female share is estimated at around 39% and variability across countries appears to be relatively low, with values ranging from 35% in Austria to 44% in Portugal. In the three most populous countries (Germany, France and the UK), the shares stand at 36-41%. In comparison, North America and Australia have similar but slightly lower shares than those found in Europe: the US and Canada exhibit shares of 38-39%. This means that men capture around 62-64% of total labor income, i.e. more than half as much again as women. This illustrates the magnitude of systemic gender inequality
– a simple fact that can be overlooked in indicators on gender gaps that control for the type of job or occupation held by men and women.
Latin American countries appear to be relatively homogeneous. There, the average female labor income share stands at 35% with values ranging from 26% in Guatemala to 42% in Barbados. In the two most populous countries (Brazil and Mexico), the shares are 38% and 33% respectively.
Asian countries exhibit lower shares than Europe and North America, with an average of 27%. There appears to be a strong east- west distinction, with East Asian countries exhibiting much higher shares. Eleven countries have values above 30% while two (Pakistan and Afghanistan) exhibit shares below 10%. The two most heavily populated countries (China and India) exhibit shares of 33% and 18% respectively.
“MENA” countries (the Middle East and North Africa) exhibit low levels of female labor income share, with an unweighted average of 15%. A majority of them have shares under 20% and five (Yemen, Iraq, Saudi Arabia, Qatar, Oman) are under 10%. Israel stands out with a share of 38%.
Female labor income shares are found to be higher on average in Sub-Saharan Africa, with an average value of 28%. The two countries with the lowest shares (Somalia and Chad) are around 8%. The four countries with the highest shares (Eritrea, Botswana, Namibia, Guinea-Bissau) are around 40%. These values illustrate the wide variation of the female labor income share across the continent.
The regional perspective provides some clues about the levels observed. “MENA” countries share religious and cultural backgrounds, with social norms that tend to hinder the participation of women in the labor market3. In contrast, former Eastern Bloc countries share a history of communist regimes that supported the participation of women in the labor market through law and policy4. From that perspective, the case of China raises some questions, given its historically strong policy emphasis on gender equality and high female labor force participation, illustrated by the slogan of the Communist Party of China – “Women hold up half the sky” – proclaimed by Mao Zedong. China’s female labor income share has decreased substantially since 1990. While it is still high by Asian standards, it is much lower than in the former Eastern Bloc countries.
Evolution of women’s income share across the world
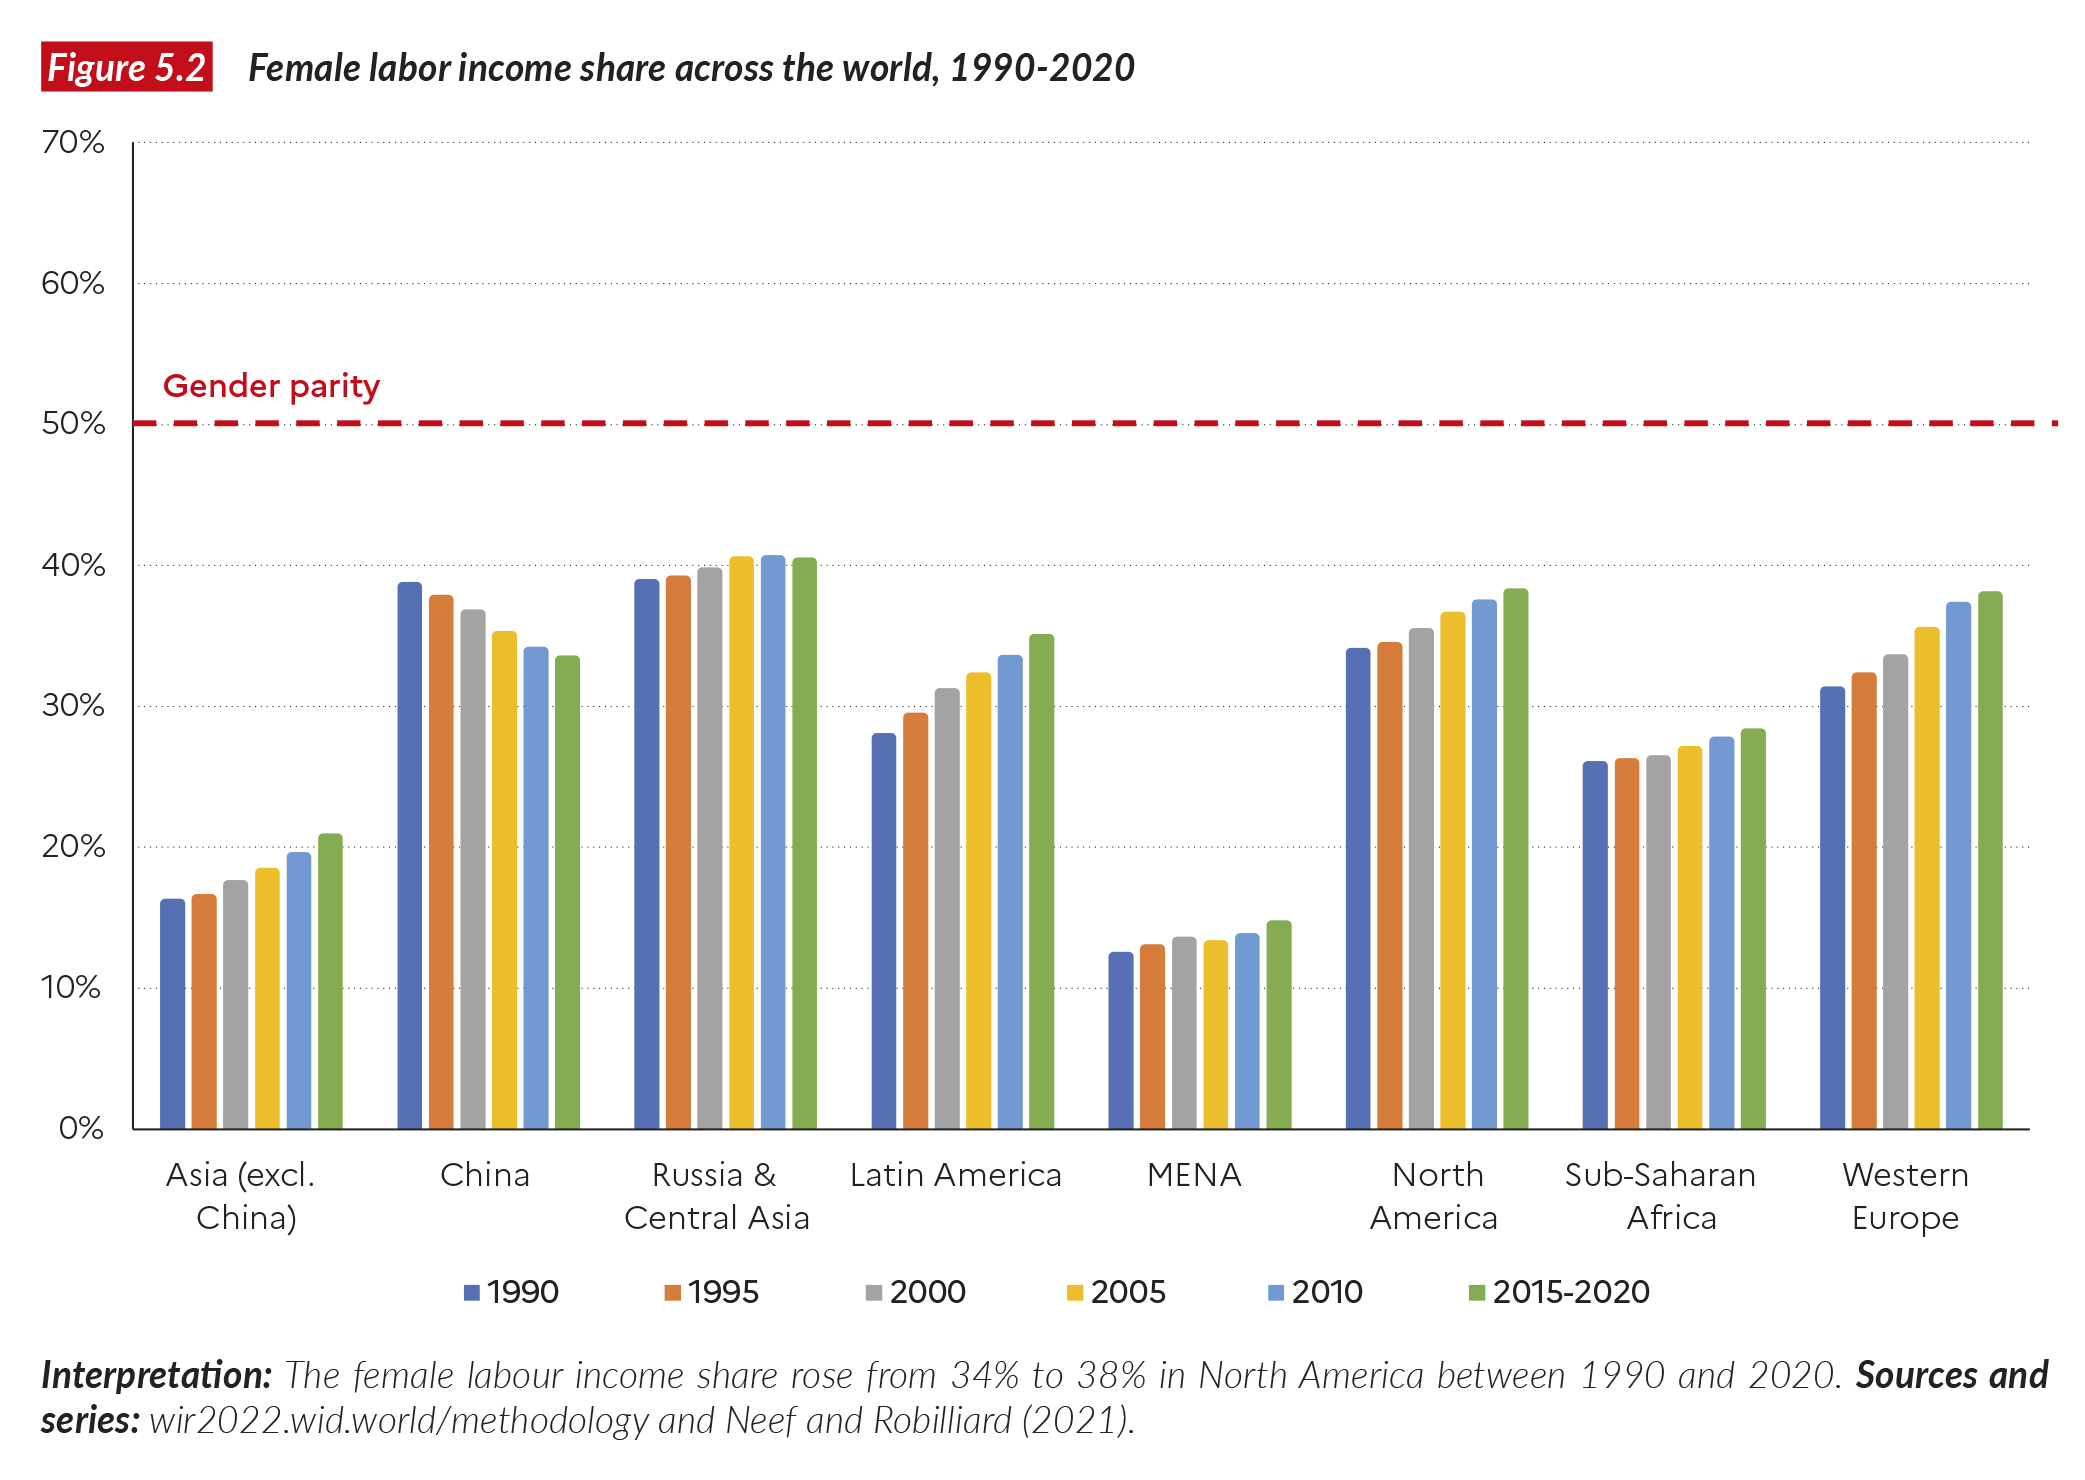
Figure 5.2 presents the level and evolution of women’s income share across the regions of the world from 1990 to 2019 in 5-year brackets. The figure confirms the strikingly low position of “MENA” and Asian countries (excluding China) relative to the other regions. In terms of evolution over time, the female labor income share appears to have increased in all regions except China. The evolution is strongest in Latin America and Western Europe. It is much slower in Asian and “MENA” countries, Sub-Saharan Africa, Oceania and North America, as well as in former Eastern Bloc countries, where it appears to have stagnated in the last two decades.
The downward trend for China might seem surprising at first. According to our estimates, the female labor income share has declined significantly over the period, from 39% in 1991 to a little more than 33% in 2019. This result is supported by several studies that indicate a declining trend and only slow progress towards gender equality despite historically strong policy emphasis on gender equality and high female labor force participation.5 According to these studies, the decline could be explained by various factors, including the downsizing of state-owned enterprises (SOEs), which led to a sharper decline in labor force participation among urban women than among urban men, and the relaxation of the One-Child Policy at the end of 2013, among others.
Women earn just a third of labor income across the globe
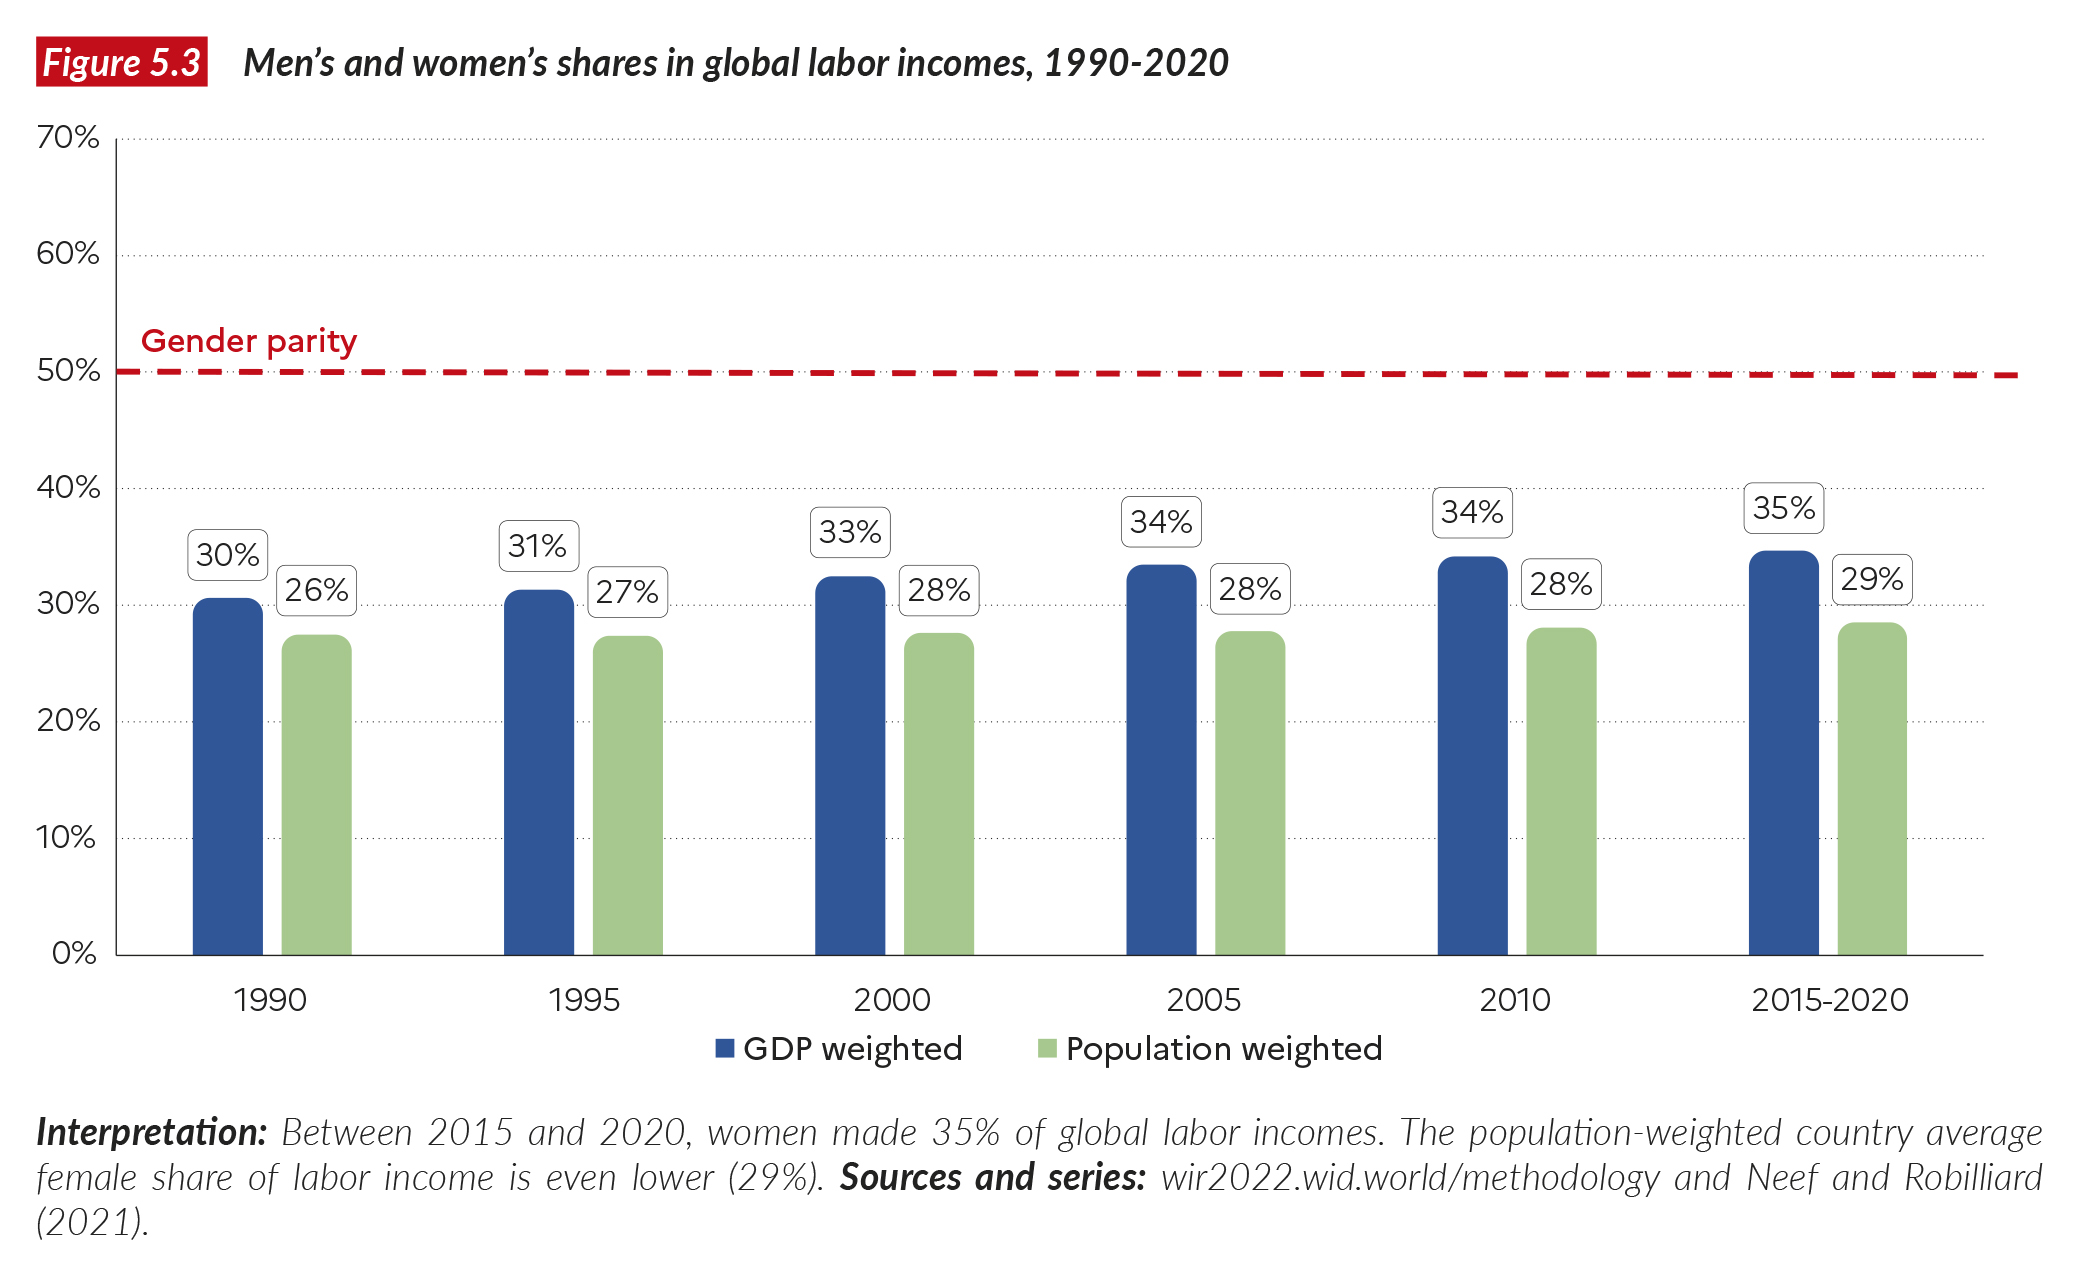
How do the regional changes translate at the global level? Figure 5.3 provides two different answers. The first metric corresponds to the population-weighted average of country- level values of the female labor income share and delivers a preliminary answer: since 1994, the population-weighted average of labor income paid to women has barely changed, stagnating at around 28%. The second statistic is women’s global labor income share, computed by adding up all female labor income and dividing it by global labor income. According to this metric, women’s income share increased from 31% in the 1990- 1994 period to 35% in 2015-2019. The higher value of the global share compared with the population-weighted share can be explained by the fact that Western countries are both richer and have on average higher female income shares. These two statistics provide strong evidence that although women hold up half the sky, they only get a third of labor income for it.
Various factors have been suggested to explain gender differences in employment and earnings that result in women earning a smaller share of labor income. Among these is the fact that, according to time-use surveys, women spend substantially more time than men on unpaid care work. As shown by Ferrant, Pesando and Nowacka, this appears to be true across regions, although the female–male ratio of time devoted to unpaid care work shows great variability across countries6. In the MENA region, where the gap tends to be largest, women spend on average more than five hours doing unpaid care work per day, while men spend less than one hour7. This higher load of unpaid care work is likely to prevent women from participating in the labor market, and, when they do work, to prevent them from attaining high-paying positions. When paid and unpaid work are combined, women’s contribution to work increases substantially and thus makes the female labor income share appear even more unfair (see Neef and Robilliard for specific examples)8.
The role of pay ratios vs. employment ratios
The labor income share held by women depends on two dimensions: their labor force participation compared with men on the one hand, and the gender earnings ratio on the other hand. In order to understand both the regional differences and the evolution over time of the female labor income share, it is interesting to see how earnings and employment ratios vary across regions and have evolved over time. In this chapter, we use ratios instead of gaps to make it easier to compare the values with the female income shares presented earlier: female labor income shares increase with both ratios. In other words, when both the earnings and employment ratios are high, women’s labor income share is high as well. The results are presented on Figure 5.4.
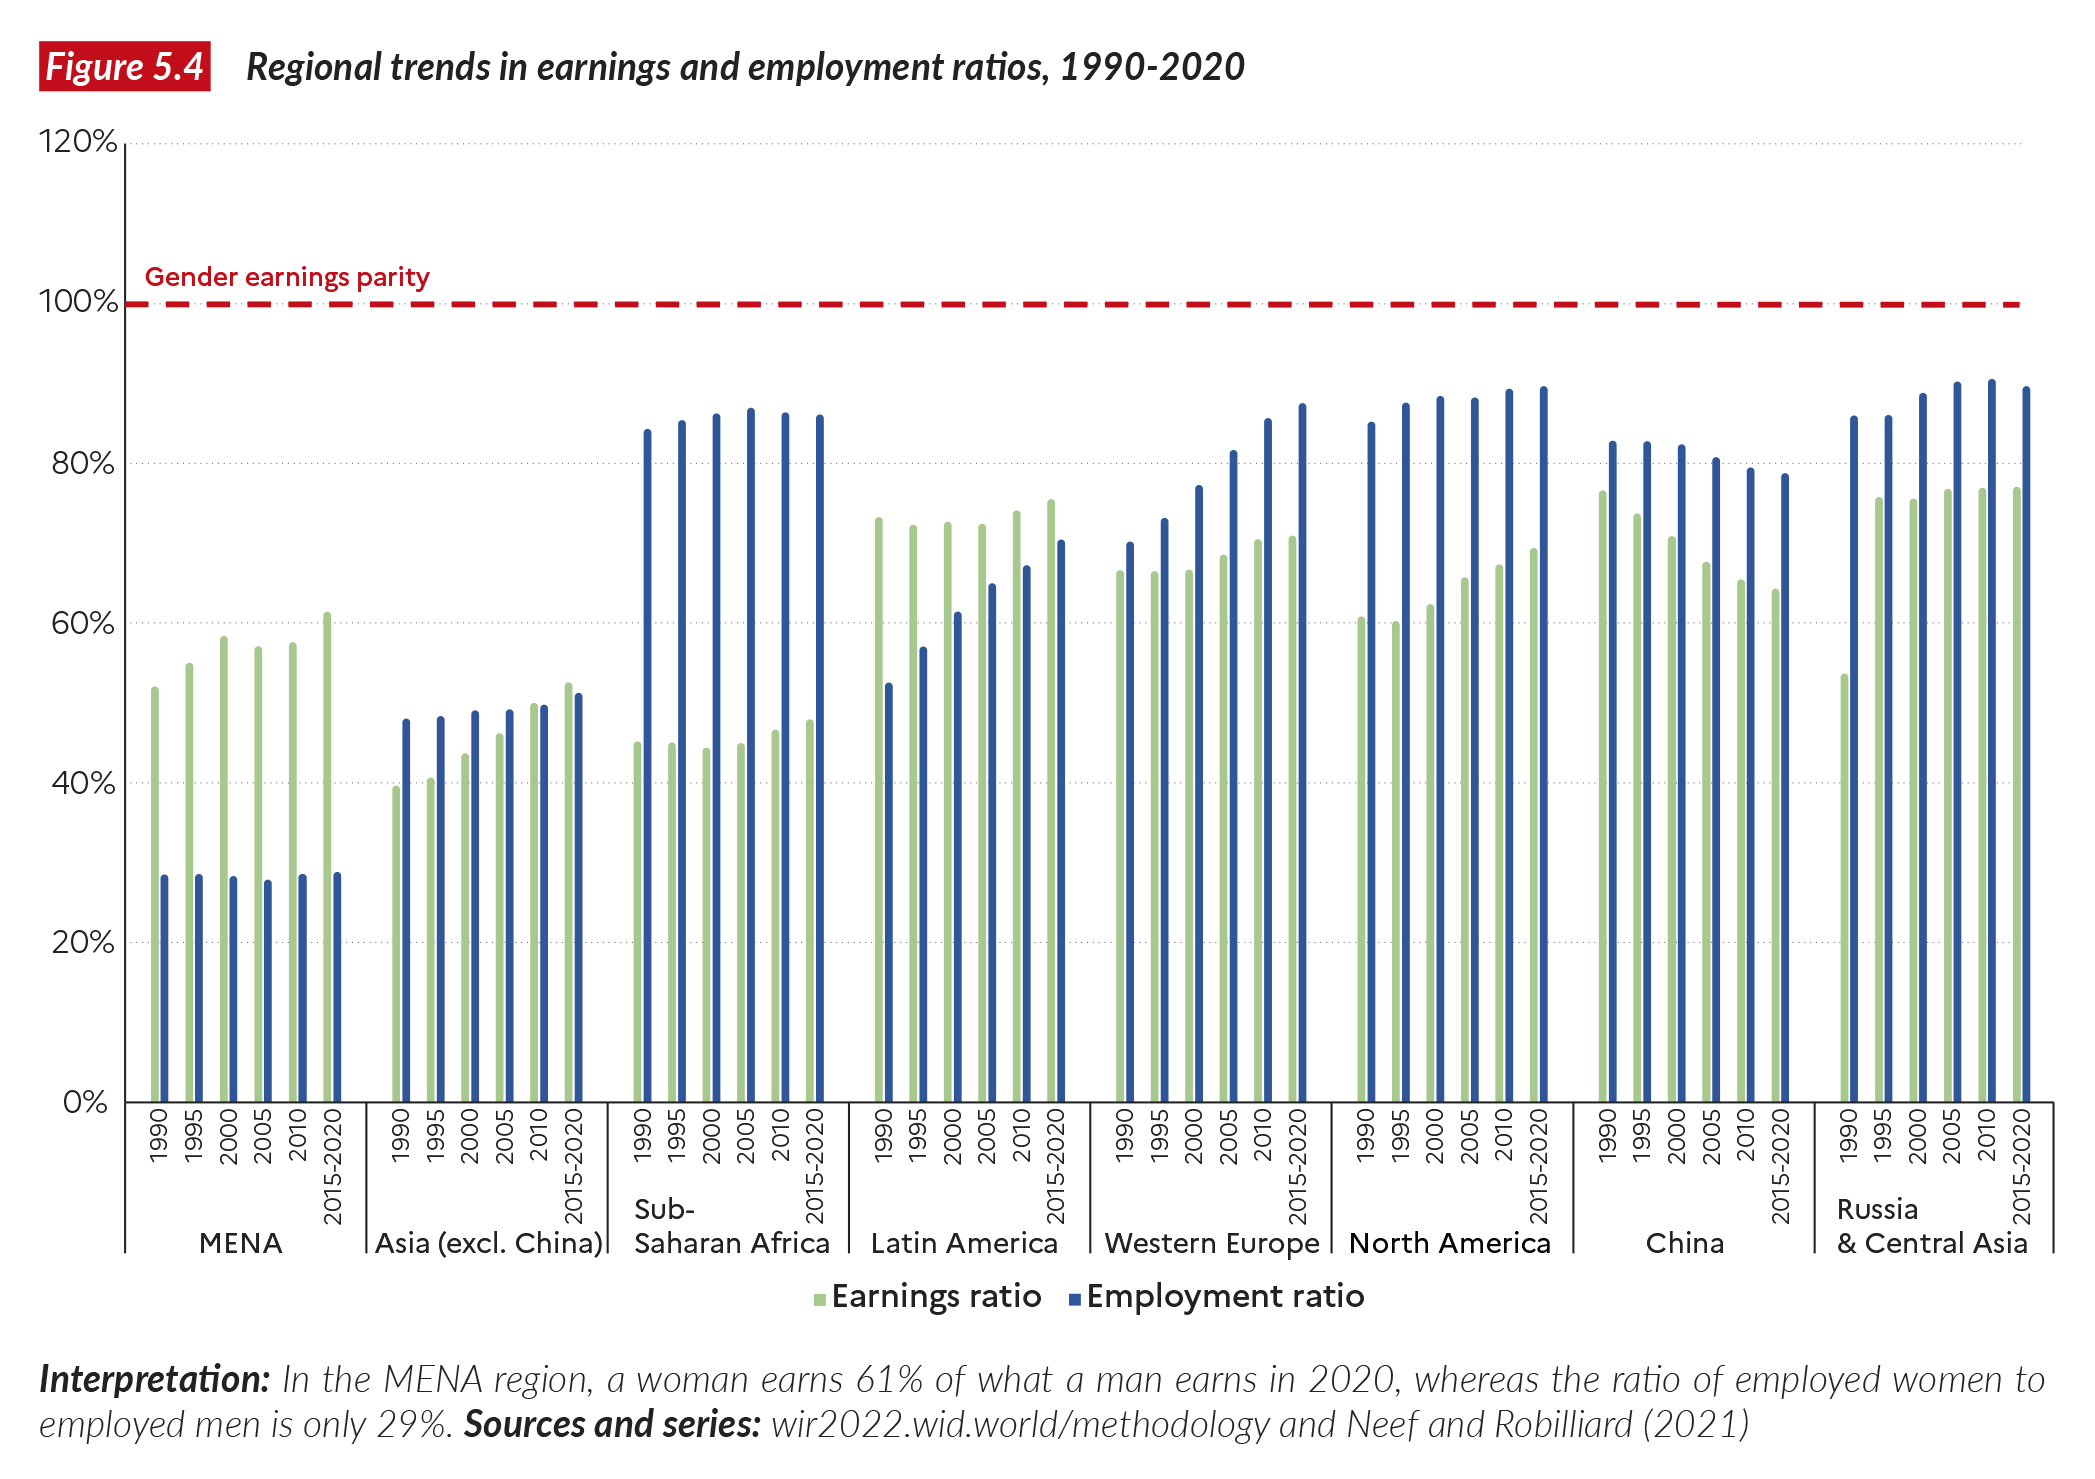
Asia (excluding China) and the “Middle East and North Africa”, which both exhibit low female income shares, seem to have different underlying determinants. In Asia, the female- to-male employment ratio is higher than in the”MENA” region, while the female-to-male earnings ratio is comparatively lower. In other words, women participate more in the labor market in Asia than they do in “MENA”: the employment ratio is close to 50% on average over the period in Asia, as against 28% in “MENA”. Conversely, when working, women’s earnings as a share of male earnings is a little more than 44% in Asia and 59% in “MENA”. This pattern hints at a particular selection process in the labor market in the “MENA” region, whereby only high-earning women participate.
Moving to other regions, Sub-Saharan Africa exhibits a very high employment ratio: it stands at 86% on average over the whole period. And yet, the female earnings ratio is much lower, at 46%. Women in this region have broad access to paid work, but are paid much less than men.
As in “MENA”, results for Latin America are consistent with the selection of higher-earning women into the labor market: here again the employment ratio is lower than the earnings ratio. However, the employment ratio in Latin America is much higher than in “MENA” and shows an increase during the 1990-2020 period. This increase in the employment ratio could signal a convergence toward a labor market structure similar to that in Western Europe and North America.
Turning to Western countries, the ratio pattern is similar across Western Europe, North America and Oceania: in all three regions, the employment ratio is high (88-90% in the 2015-2020 period) and has been increasing since 1990. In contrast, the earnings ratio is lower (71% in Western Europe and 69% in North America and 59% in Oceania) and while it has increased in Western Europe and North America, it seems to have decreased in Oceania since 1990.
Finally, China and the former Eastern Bloc countries exhibit a similar pattern to that of Western countries (i.e. employment ratios are higher than earnings ratios). The main difference between China on one side and North America and Europe on the other is the trend in both employment and earnings ratios, which have been declining, as discussed above.
Breaking the glass ceiling: women at the top of the wage distribution
Since women have overtaken men in educational attainment in many countries since the 1990s, the key factors inhibiting the closing of the gender pay gap are linked to the horizontal and vertical segregation of labor markets9. This section takes a closer look at the phenomenon of vertical segregation, which is shown empirically in the under-representation of women at the top of the wage distribution. Analyzing the very top of the wage distribution requires high-quality administrative data. Since few countries provide such data at an individual level, from social security records or tax data, this part of the analysis is limited to the US, Spain, Brazil, and France.
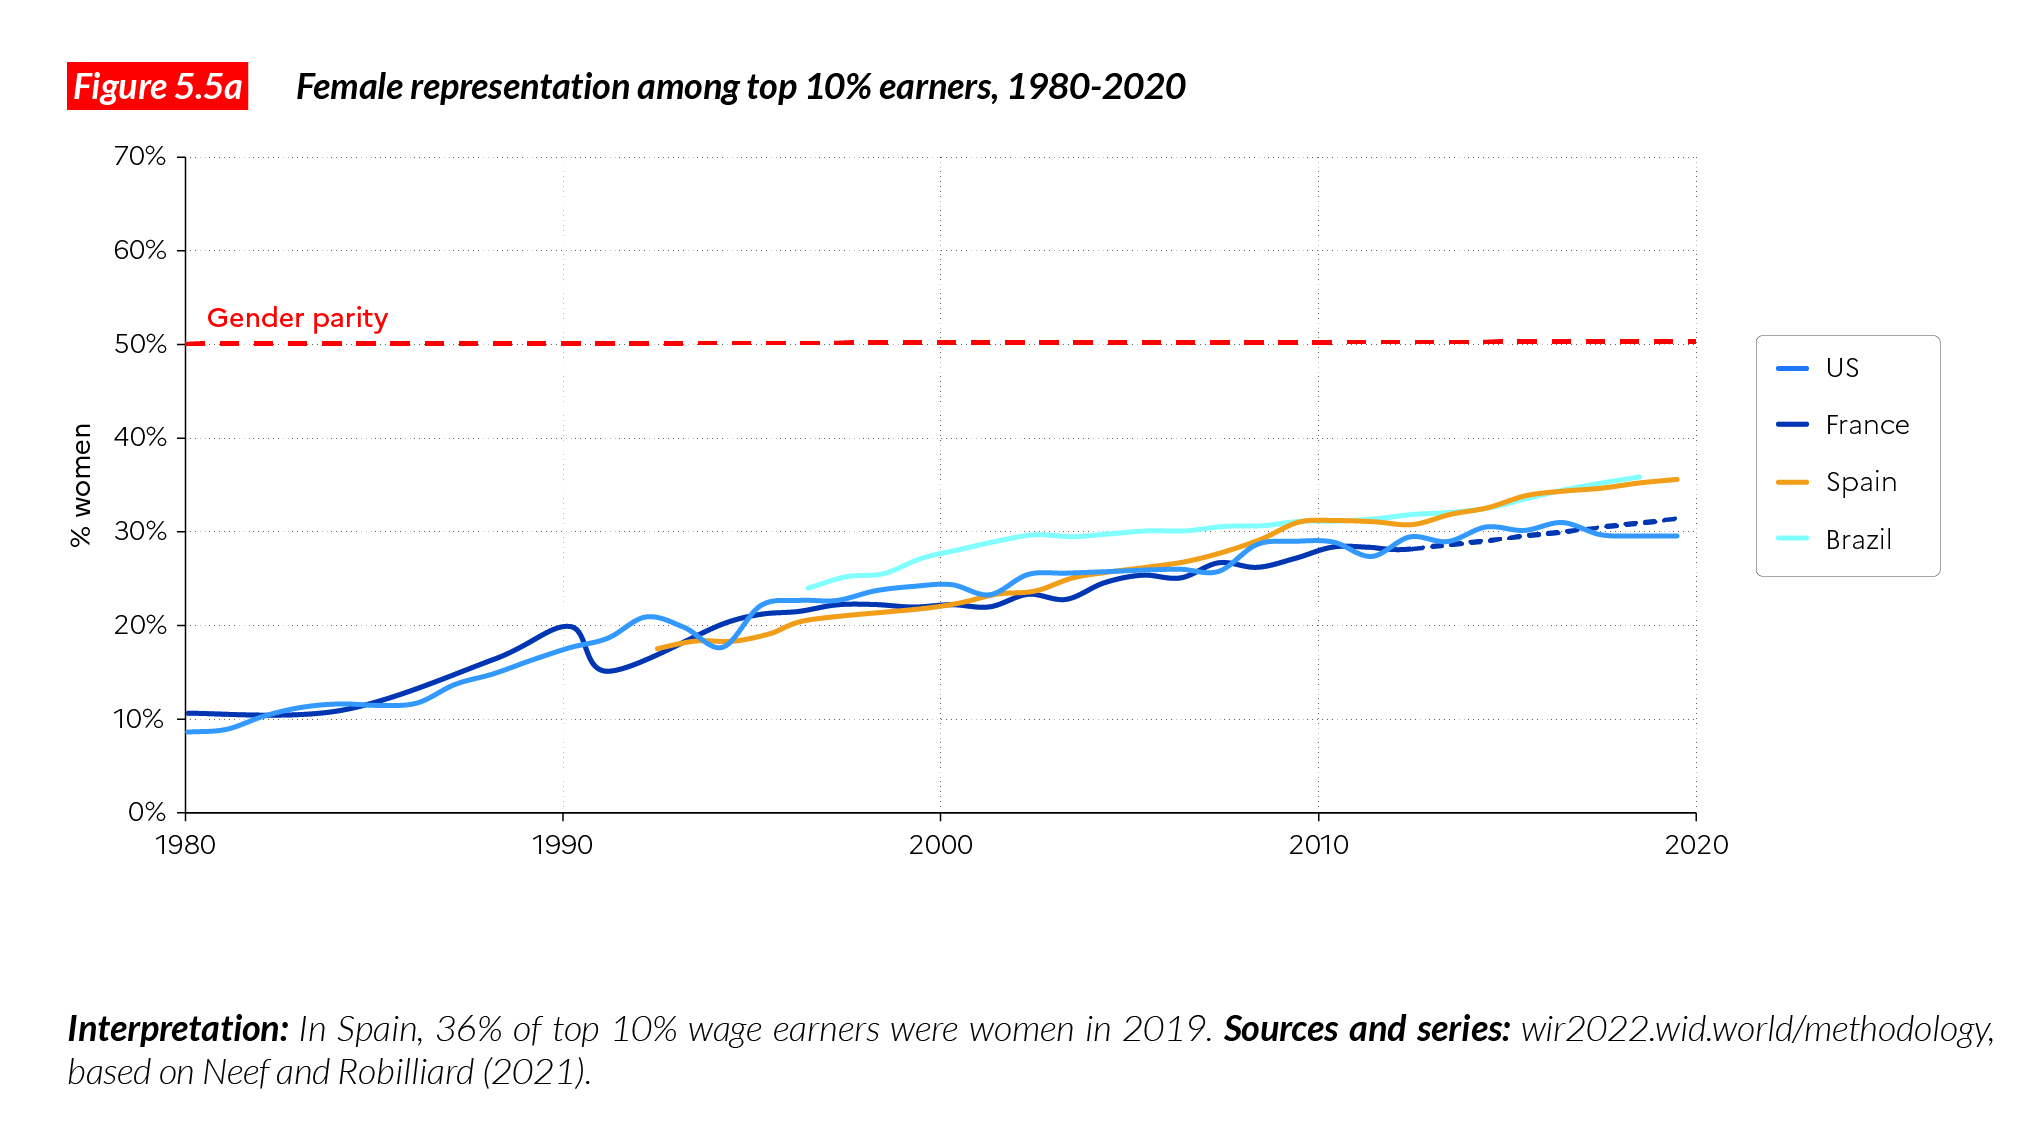
Figures 5.5ab Figures 5.5ab present women’s representation among wage earners and at the top of the wage distribution in Brazil, Spain, France and the US. All countries show an increasing representation of women at the top of their wage distributions since the 1990s. While the share of women in the top 10% of the US wage distribution rose from 22% in 1995 to 30% in 2019, in the same year, Spanish women increased their share from 19% in 1995 to almost 36% (Figure 5.5a). Similarly, Brazilian women’s representation in the top 10% of wage earners grew from 24% in 1996 to about 36% in 2018. Brazil, and Spain show a substantially higher representation of women in the top 10% of wage earners than the US or France in recent years.
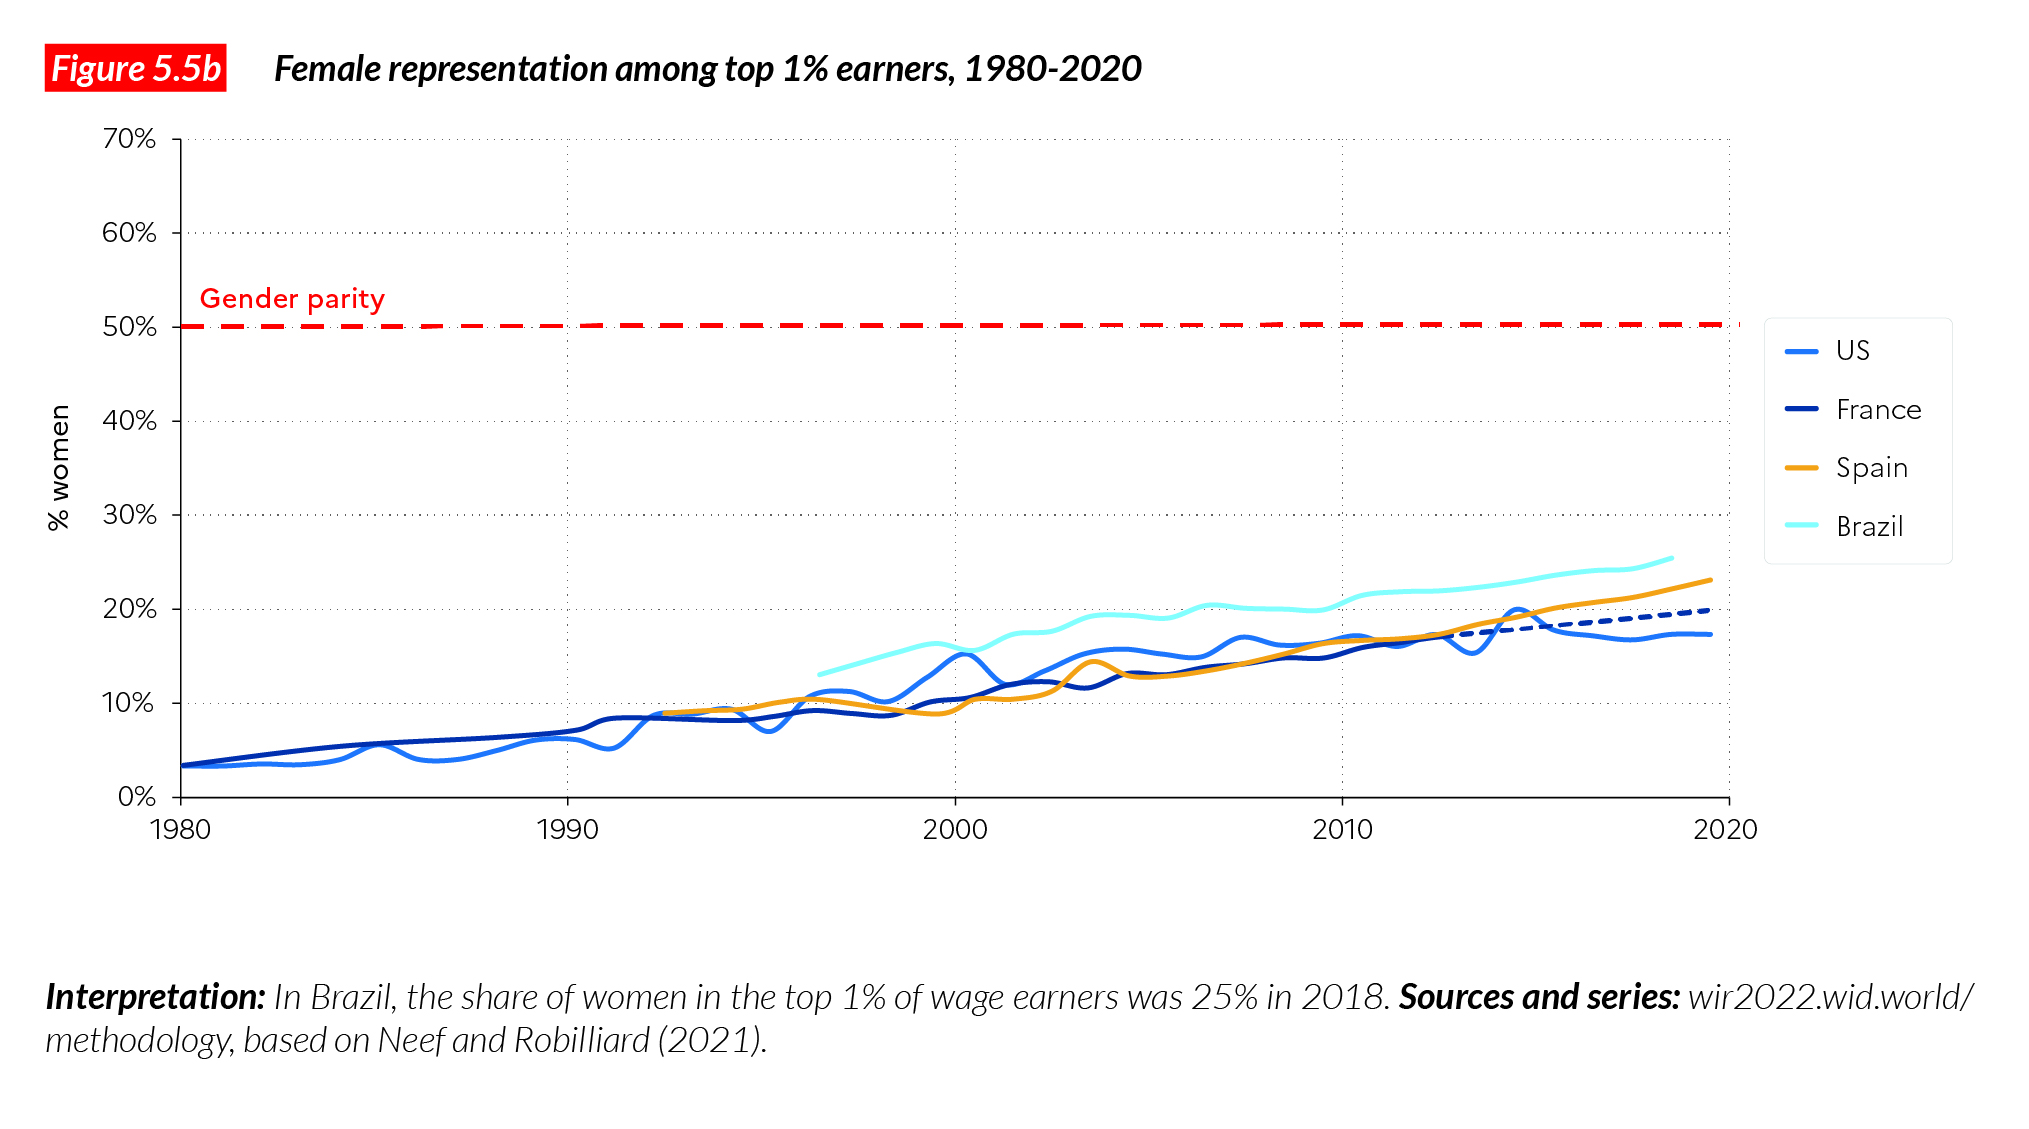
Women’s representation in the top 1% is substantially lower than in the top 10% in all countries, indicating that there is a strong “glass-ceiling” effect, whereby the wage gap increases towards the top of the wage distribution, the main driver of which is the under-representation of women in top- paying positions10. The representation of women in the top 1% has been increasing only slowly in the United States, and has been faster in Spain and Brazil (Figure 5.5b). It is striking that today women are better represented in the top 1% in Spain and Brazil than in the US, which led the way in women’s empowerment in the 20th century.
Thus, overall, women are still under- represented at the top of the national wage distributions though to differing degrees and the glass ceiling effect seems particularly pronounced in the US and France, whereas Spain and Brazil have a relatively high female representation at the top of their wage distributions. The reasons for these cross-country differences are not easily detected. Spain and Brazil have only increased the representation of women among all wage earners in recent years and have not reached parity in the labor market. This could hint at a selection effect – only the more highly-skilled women enter formal wage employment. However, these three countries might also have promoted gender equality by increasing the compatibility of career and family with more generous state- subsidized childcare, or boosted women at the top using quotas and other policies promoting women’s job advancements. Yet another reading is possible: Goldin stresses that the last step toward gender equality in the US labor market is the temporal inflexibility of many high-paying jobs, particularly the more than proportional reward for working long hours in executive jobs, which many women cannot do because of childcare and household duties11. Thus, the difference between the glass ceiling effects in the US on one side and Brazil and Spain on the other, might also be due to different structures in the high-paying wage sectors. Knowing whether the difference emerges from progressive policies or from the different structure and time inflexibility of jobs at the top of the wage distribution requires further research.
Box 5.1 Methodology
The data series used for this chapter represent the largest database on the historical evolution of women’s labor income share across the world, spanning from 1990 to the eve of the Covid crisis. They are based on work carried out at the World Inequality Lab that combines different international data sources. The full methodology is detailed in Neef and Robilliard’s study12. We present below the general methods followed.
Cross-country analyses of gender inequality are inherently difficult due to differing labor income concepts, and whether specific sectors and part-time workers are included or excluded13. Neef and Robilliard overcome this difficulty by making use of harmonized survey data from the Luxembourg Income Study (LIS) and the EU-SILC. This allows them to calculate women’s share of total labor income directly from survey micro data for 58 countries. Using these LIS and EU-SILC data, they estimate a simple regression model of the female share of total labor income on wage and self- employment shares, which then allows them to impute the female share in labor income for all countries and years using ILO-modeled estimates of wage and self-employment shares – the most globally comprehensive source on labor market participation and earnings indicators. Finally, the LIS-SILC and imputed series are combined. For countries for which LIS or EU-SILC data is available, Neef and Robillard interpolate linearly between data points and extrapolate backward and forward using imputed estimates. For countries with no labor income data, they use imputed estimates. Country-level female labor income shares provided in this chapter should thus be interpreted with caution, but they provide valuable information when considered from a cross-country comparative perspective.
On this basis, it is possible to investigate the levels and evolution of women’s share of labor income across the world’s regions. Further, Neef and Robilliard break down this share into its two main parts: the gender earnings ratio and the gender employment ratio. Finally, drawing on high-quality administrative data for Brazil, Spain, and the US, they explore the representation of women at the top of the wage and salary distribution and illustrate the so-called glass-ceiling effect of a widening gender gap toward the top of the distribution.
Box 5.2 Gender inequality metrics
Gender inequality has many dimensions and different metrics should be used to properly track its dynamics across the globe. The analysis of labor income shares is an important dimension because it shows how incomes are split between women and men at the level of a society as a whole (rather than in a given sector of the economy or a given position). It offers a more systemic perspective than the income gaps that are typically discussed in public debates. The female labor income share is also straightforward to interpret: since women represent half the population, in a gender equal society they would earn half of all labor income.
Other indicators should also be looked at to grasp the various facets of gender inequality. The United Nations Human Development Programme, for instance, has defined a Gender Inequality Index, which combines various dimensions of inequality14. On top of women’s participation in labor markets, these dimensions include health and “empowerment”. Health indicators combine data on maternal mortality and teenage births. “Empowerment” indicators include gender inequality in access to both higher education and to seats in parliament. These indicators are aggregated into a single index, which has a value of 0 in places where there are no gender inequalities and 1 represents extreme inequality between genders15. Table B5.1 presents indicator values for different world regions in 2018. It is striking, for instance, that maternal mortality ratios can vary by a factor of 20 between Europe/Central Asia and Sub- Saharan Africa, whereas inequality in shares of parliamentary seats varies by a factor of just two between the most unequal and the least unequal regions. It should be stressed that all regions, whether rich or emerging, remain extremely unequal in terms of representation of women in parliament.
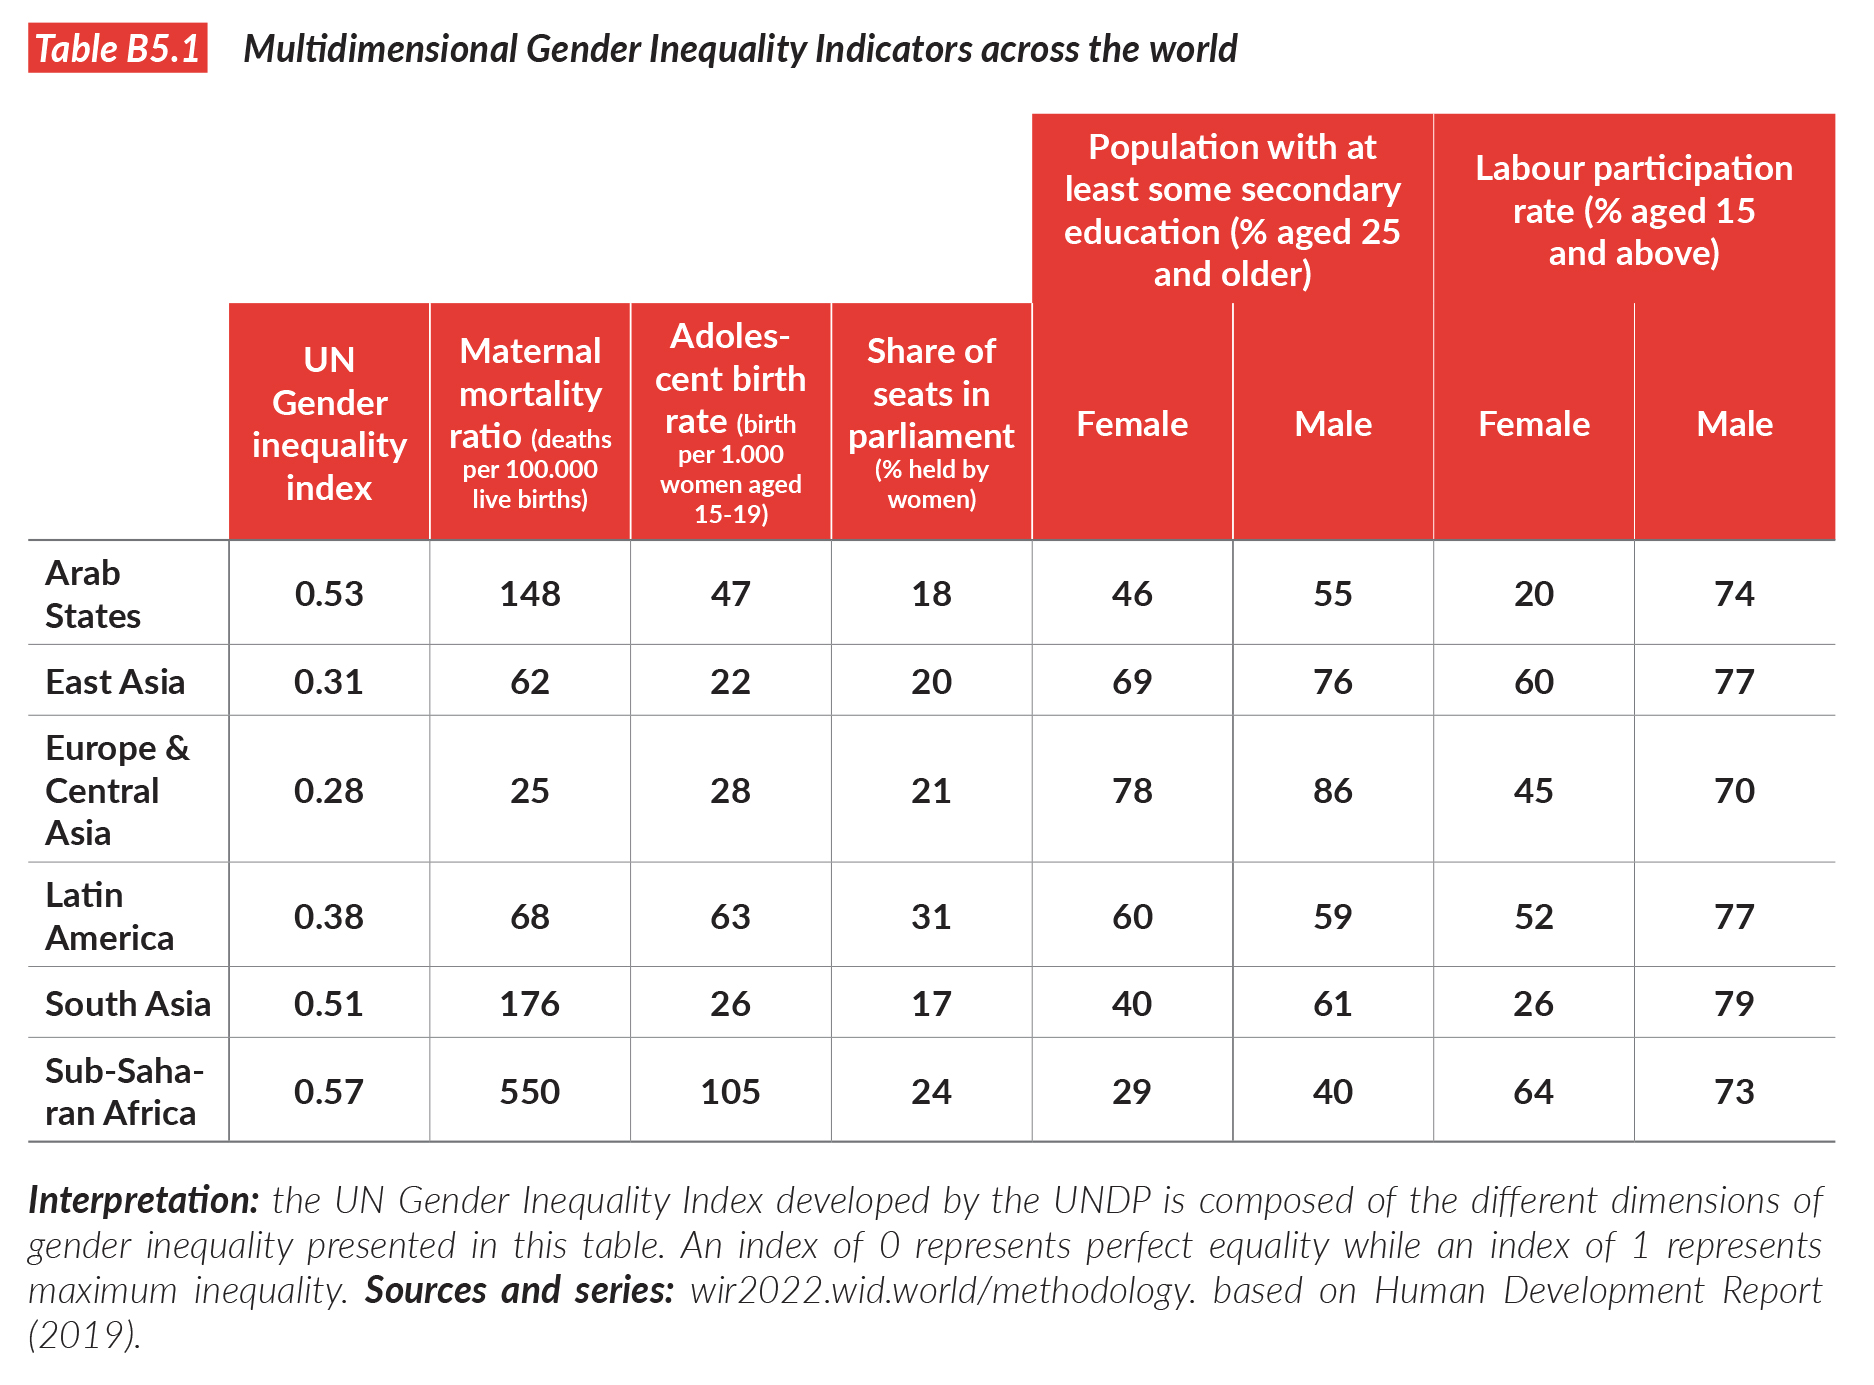
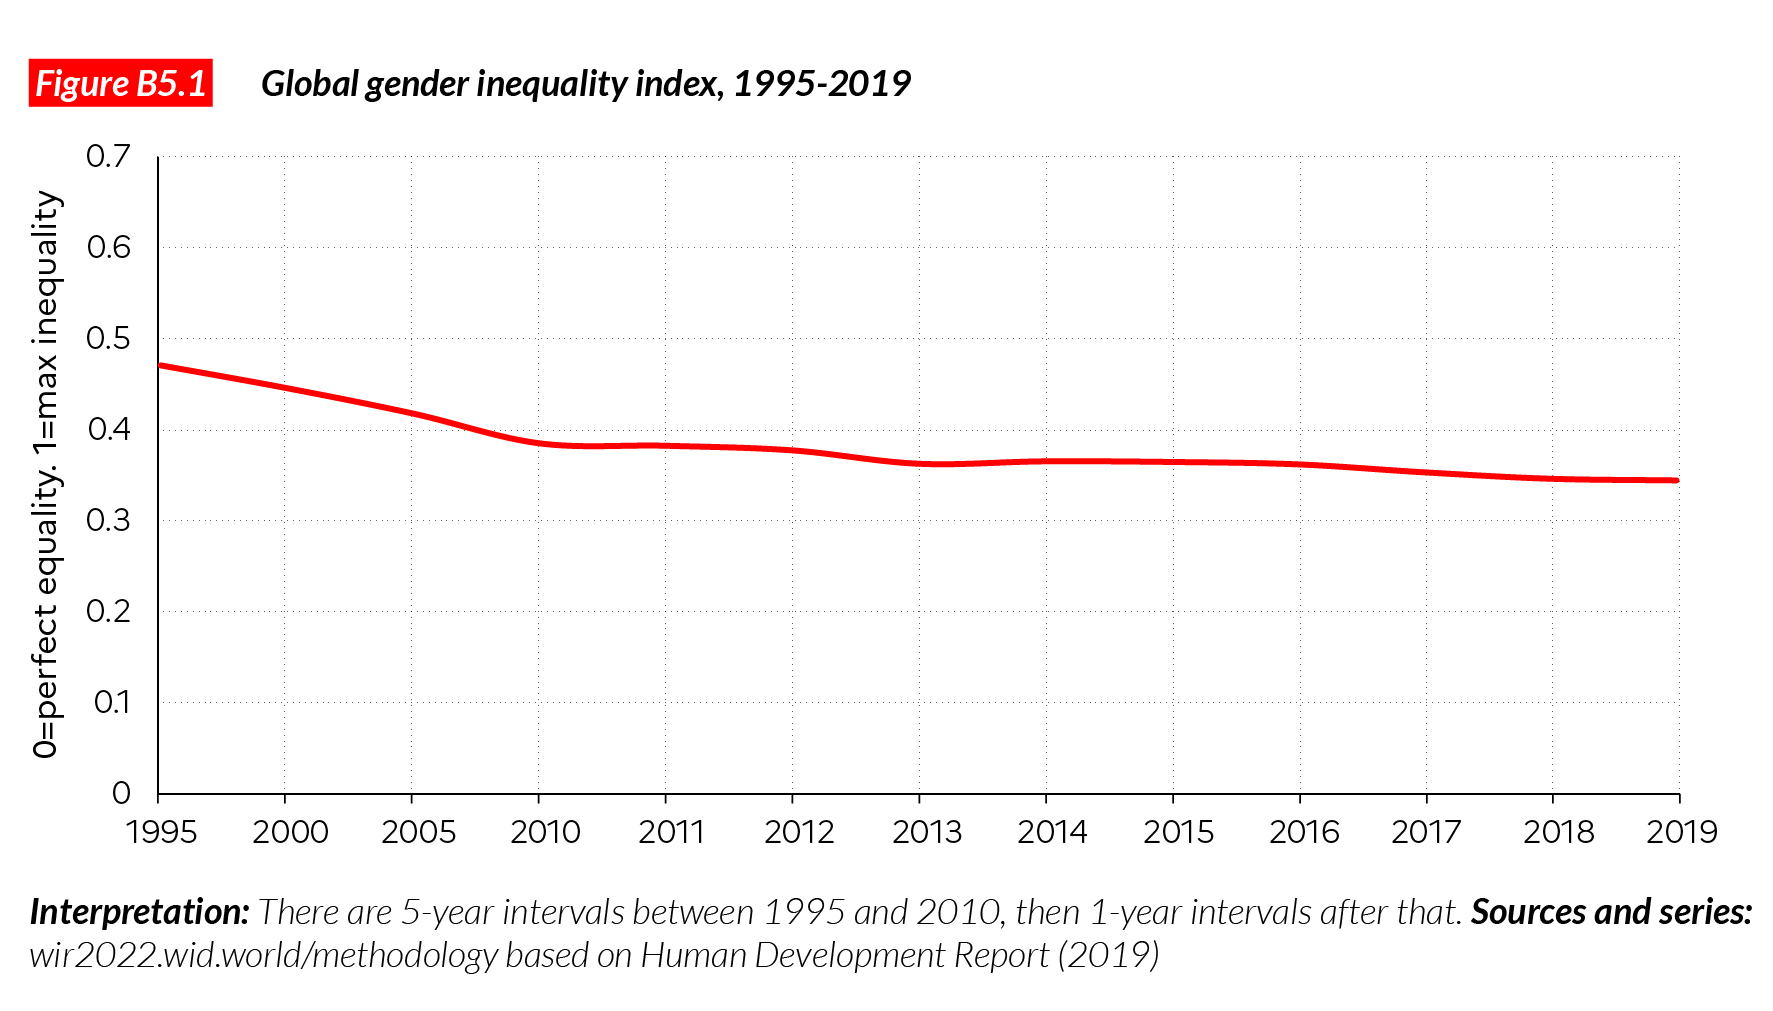
Figure B5.1 shows the evolution of the average gender inequality index across the world between 1995 and 2019. It reveals that there has been an overall improvement in gender equality between 1995 and 2010 but a stabilization afterward. Progress before 2010 was mainly due to advances in access to education (with women almost reaching parity in average primary enrollments) and in health. The maternal mortality rate declined by 45% from 2000, but since the late 2000s, progress has been much slower. This overall pattern both complements and contrasts with the trends presented in this chapter. While we observe some progress since 1995, it remains very limited (as we have shown, the GDP- weighted global labor income only slightly increased since 1990 and the population- weighted share has stagnated).
The strength of multidimensional indexes is their ability to summarize complex realities in a single composite indicator. Multidimensional aggregations have inherent limits: the construction of these indicators can be quite complex from a mathematical point of view, and different values are not always straightforward for the average reader (and experts) to interpret. Ultimately, what is interesting is to understand which sub-dimensions are driving the evolution of a composite indicator. Focusing on a single dimension of gender inequality will never suffice to comprehend its drivers and dynamics, but then neither will composite indexes alone.
Conclusion
To summarize, this chapter shows that income inequalities between men and women remain particularly significant both within countries and at the world level today, not only because of strong inequalities in pay differentials but also because of inequalities in types of occupation.
Most countries have increased women’s share of national labor income since the 1990s. Exceptions are China as well as some countries of the former Eastern Bloc (Lithuania, Poland, Russia, Slovenia and Slovakia), wherein the female labor income share decreased from an already high level in international comparisons. The “MENA” region exhibits the lowest female income share with a value of 15%, while the former Eastern Bloc exhibits the highest at 41%.
Globally, the share of labor income accruing to women stands at slightly under 35% and has shown a positive trend over the past three decades, up from around 31% in 1990. At the same time, the average labor income share across countries, weighted by national population, was stable at around 28% over the period. Both indicators reveal that the female labor income share has remained strikingly low over the past 30 years: men earn approximately twice as much as women across the world, on average. Such indicators are arguably more telling than standard gender pay gap measures because they take into account systemic inequalities beyond pay differentials, such as inequalities in occupational type.
However, the dynamics we observe vary across countries. In Western Europe, North America, Latin America and the Caribbean, the slight increase in the female labor income share was mainly driven by women’s increased participation in the labor market. In Asia, we observe that the earnings ratio has been on the rise. The “MENA” region shows a relatively high female earnings ratio, but low participation rates among women. This suggests that only highly paid women are selected into the labor market there. Sub- Saharan Africa, on the contrary, has a high female employment rate but a relatively low and stagnating earnings ratio.
Furthermore, the data reveal that women have increased their representation at the top of the wage distribution since the 1990s in many countries. Strikingly, while the US and France have a high representation of women among all wage earners, they lag behind in women’s representation in top income positions. Brazil and Spain exhibit much higher shares of women in the top 10% and top 1% of wage earners than the US and France.
The persistence of strong inequality in access to good jobs and to good pay, as well as the negative trajectory observed in large countries over the past decades (such as China), explain why, despite some progress at the regional and country levels, the global female labor income share has not grown more rapidly since the 1990s. In the early 2020s, working-age women continue to earn about half as much as men.
1 Neef, T., and A-S. Robilliard. 2021. “Half the Sky? The Female Labor Income Share in a Global Perspective.” World Inequality Lab. Working paper [2021/22].
2 Neef and Robilliard, “Half the Sky.”
3 See Jayachandran, S. 2021. “Social Norms as a Barrier to Women’s Employment in Developing Countries.” IMF Economic Review, 1-20.
4 Van der Lippe, T. and L. Van Dijk. 2002. “Comparative Research on Women’s Employment.” Annual Review of Sociology 28, no. 1: 221-241.
5 Dasgupta, S., M. Matsumoto and C. Xia. 2015. “Women in the labour market in China.” ILO Working Papers 994879663402676, International Labour Organization; Tang Y.& Long W. 2013. “Gender Earnings Disparity and Discrimination in Urban China: Unconditional Quantile Regression.” African Journal of Science, Technology, Innovation and Development, 5:3, 202-212.
6 Ferrant, G., L. M. Pesando, and K. Nowacka. 2014. “Unpaid Care Work: The Missing Link in the Analysis of Gender Gaps in Labour Outcomes.” OECD Development Centre.
7 Ferrant, Pesando and Nowacka, “Unpaid Care Work.”
8 Neef and Robilliard, “Half the Sky.”
9 See Meurs, D. and S. Ponthieux. 2015. “Gender Inequality.” In Handbook of Income Distribution vol 2, ed. A.B. Atkinson and F. Bourguignon. Elsevier; and Blau F. D. and L. M. Kahn. 2017. “The Gender Wage Gap: Extent, Trends, and Explanations.” Journal of Economic Literature 55, no. 3: 789-865.
10 Albrecht, J., A. Björklund, S. Vroman, et al. 2003. “Is There a Glass Ceiling in Sweden?” Journal of Labor Economics 21, No.1. January.
11 Goldin, C. 2014. “The Grand Gender Convergence. Its Last Chapter.” American Economic Review 104, no. 4: 1091–1119.
12 Neef and Robilliard, “Half the Sky.”
13 Meurs and Ponthieux, “Gender Inequality.”
14 United Nations. 2019a. “Beyond Income, Beyond Averages, Beyond Today: Inequalities in Human Development in the 21st Century.” Human Development Report. New York.
15 United Nations. 2019b. “Technical Notes” to “Beyond Income, Beyond Averages, Beyond Today: Inequalities in Human Development in the 21st Century.” Human Development Report 2019. New York. 8. http://hdr.undp.org/sites/default/files/hdr2019_technical_notes.pdf
