Global income and wealth inequality, 2021
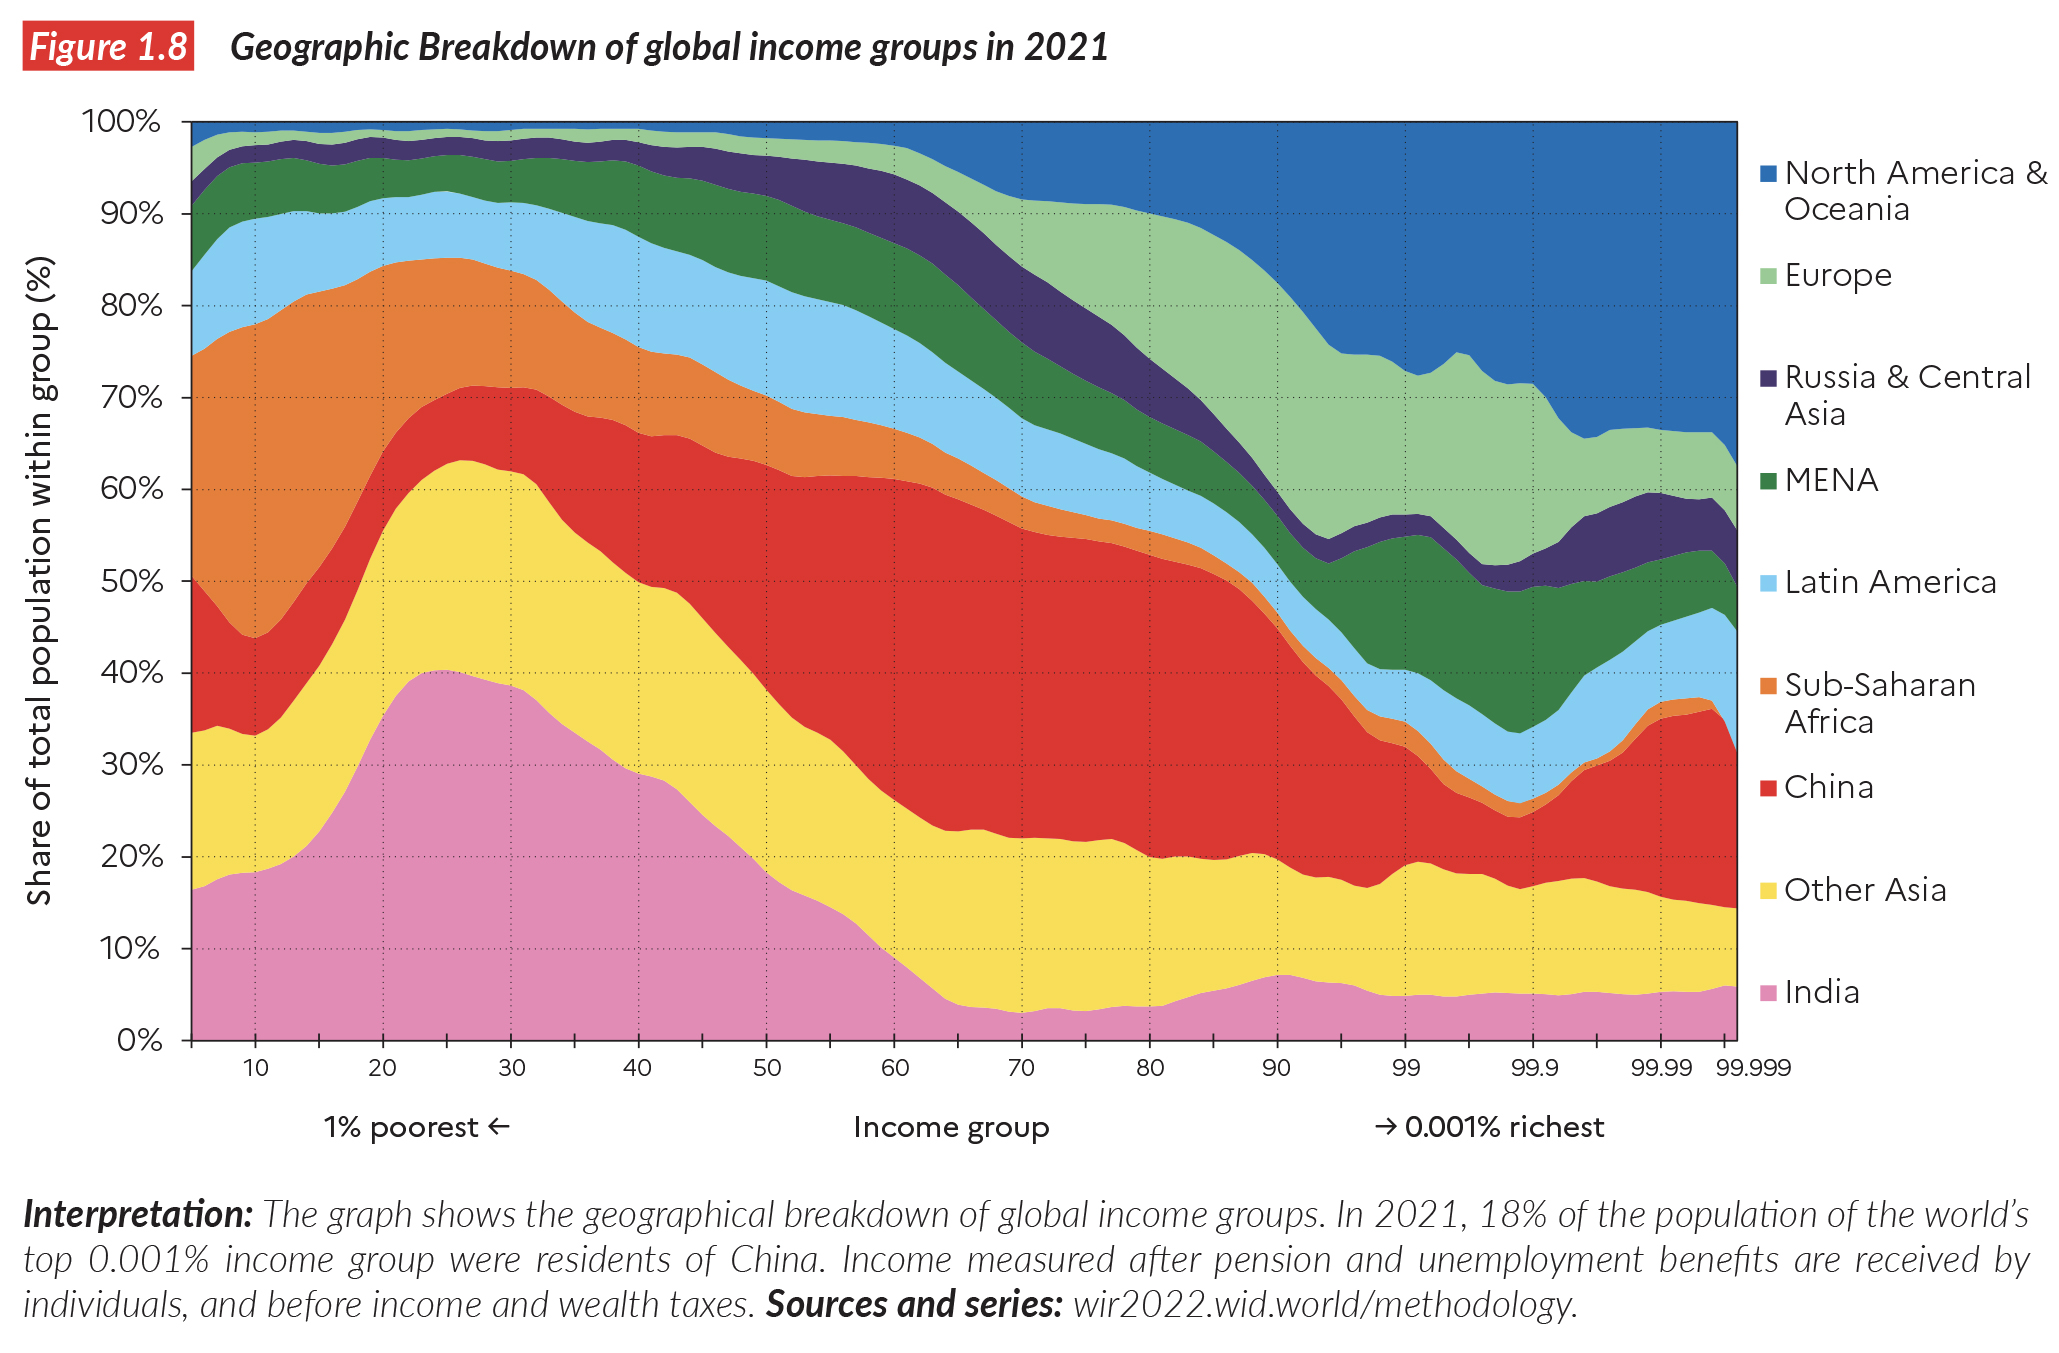
Geographic Breakdown of global income groups in 2021
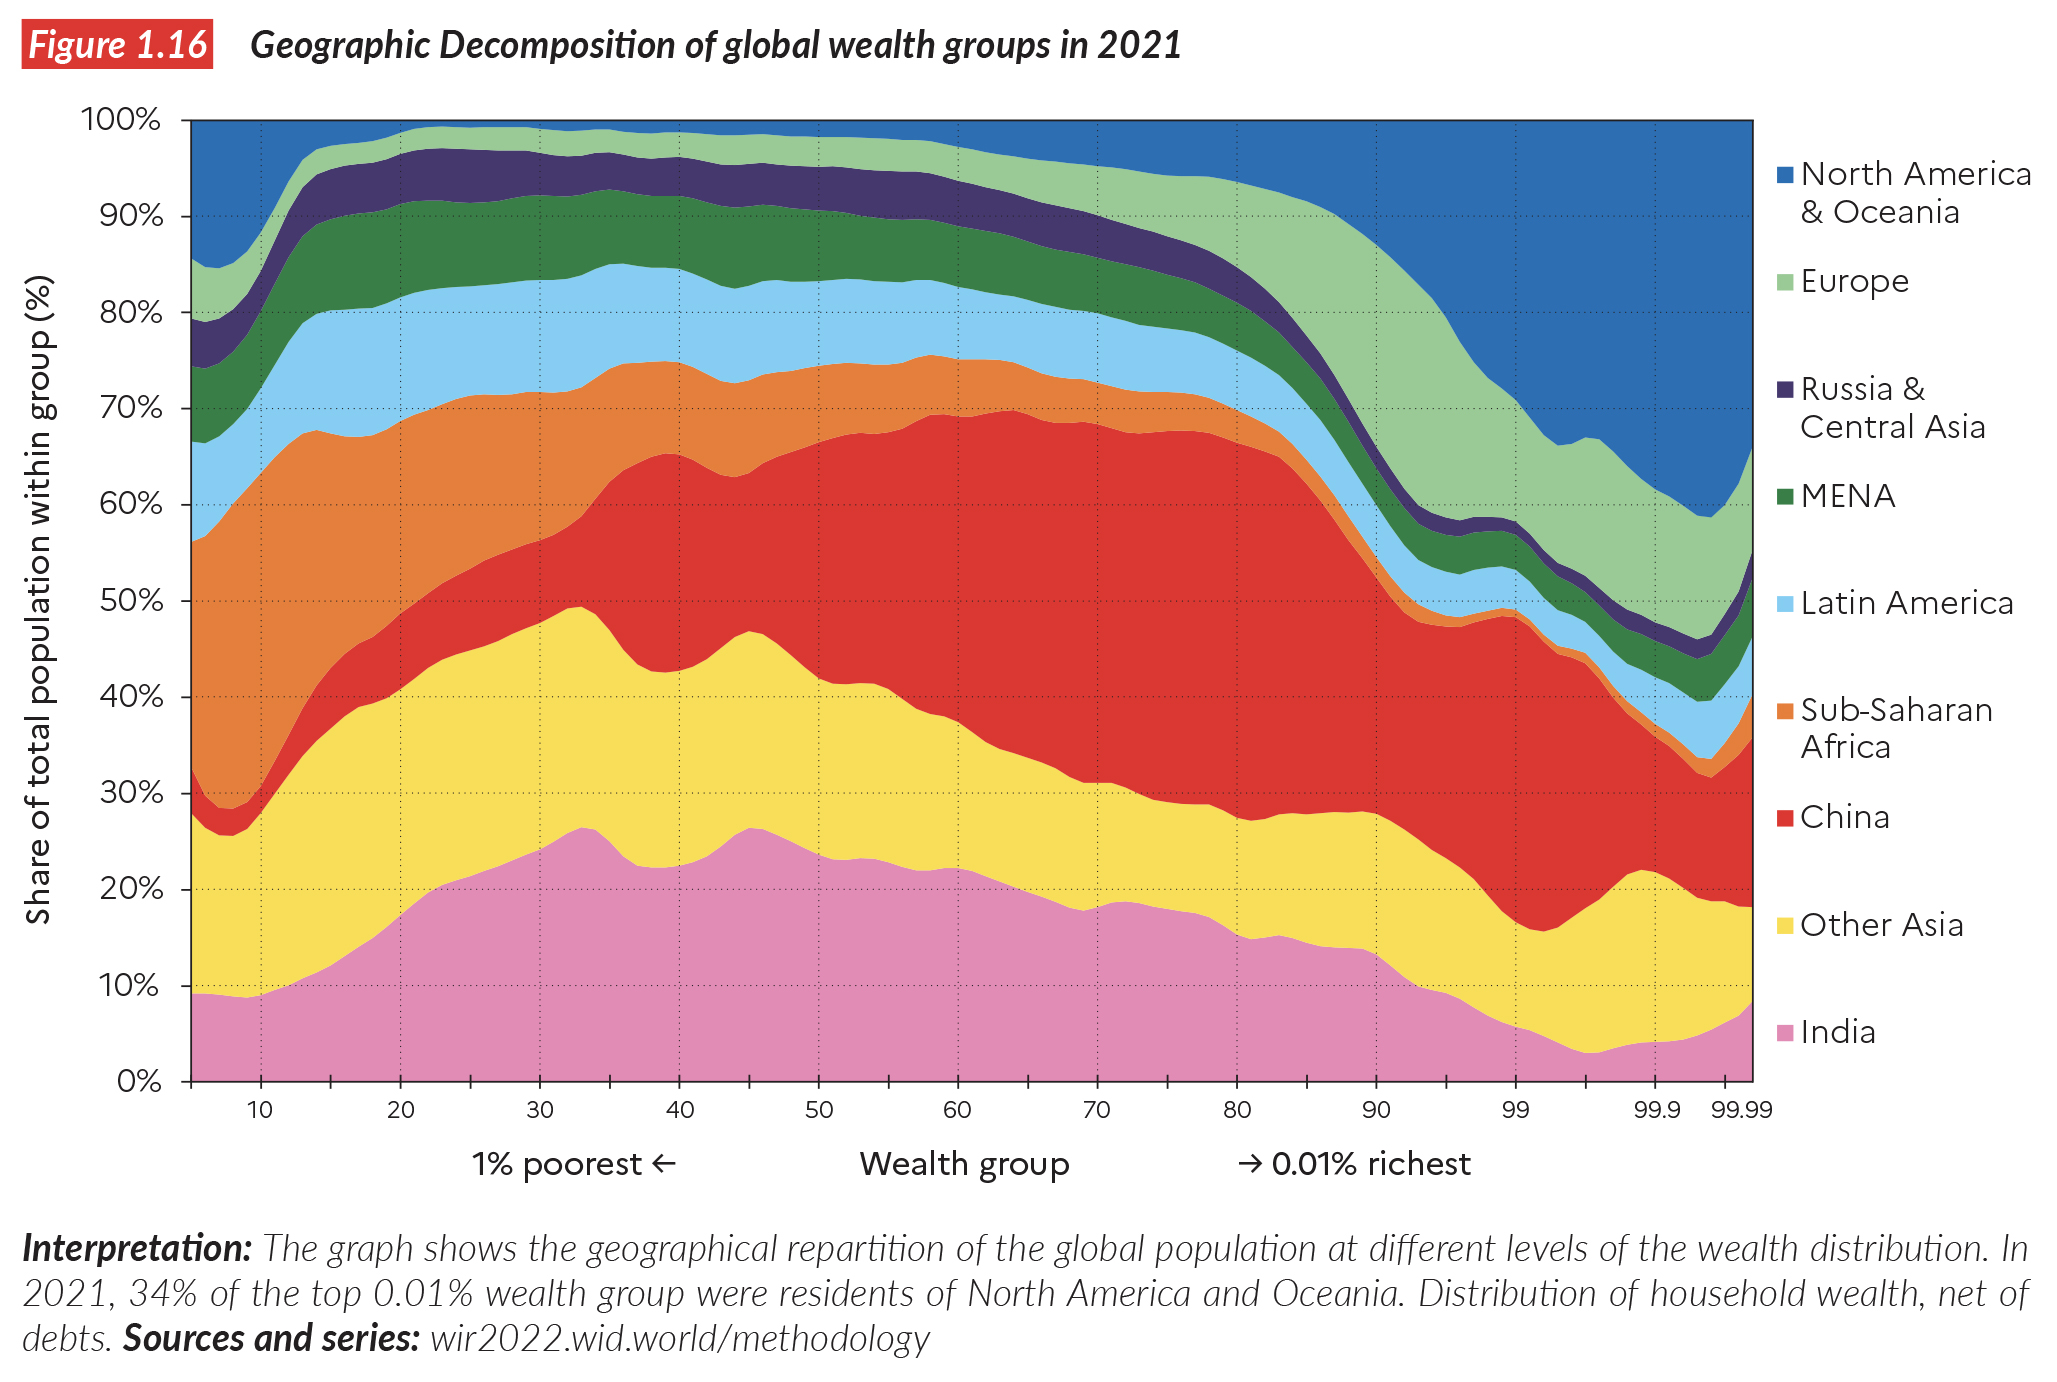
Geographic Decomposition of global wealth groups in 2021
“The Middle East and North Africa is the most unequal region in the world, Europe has the lowest inequality levels.”
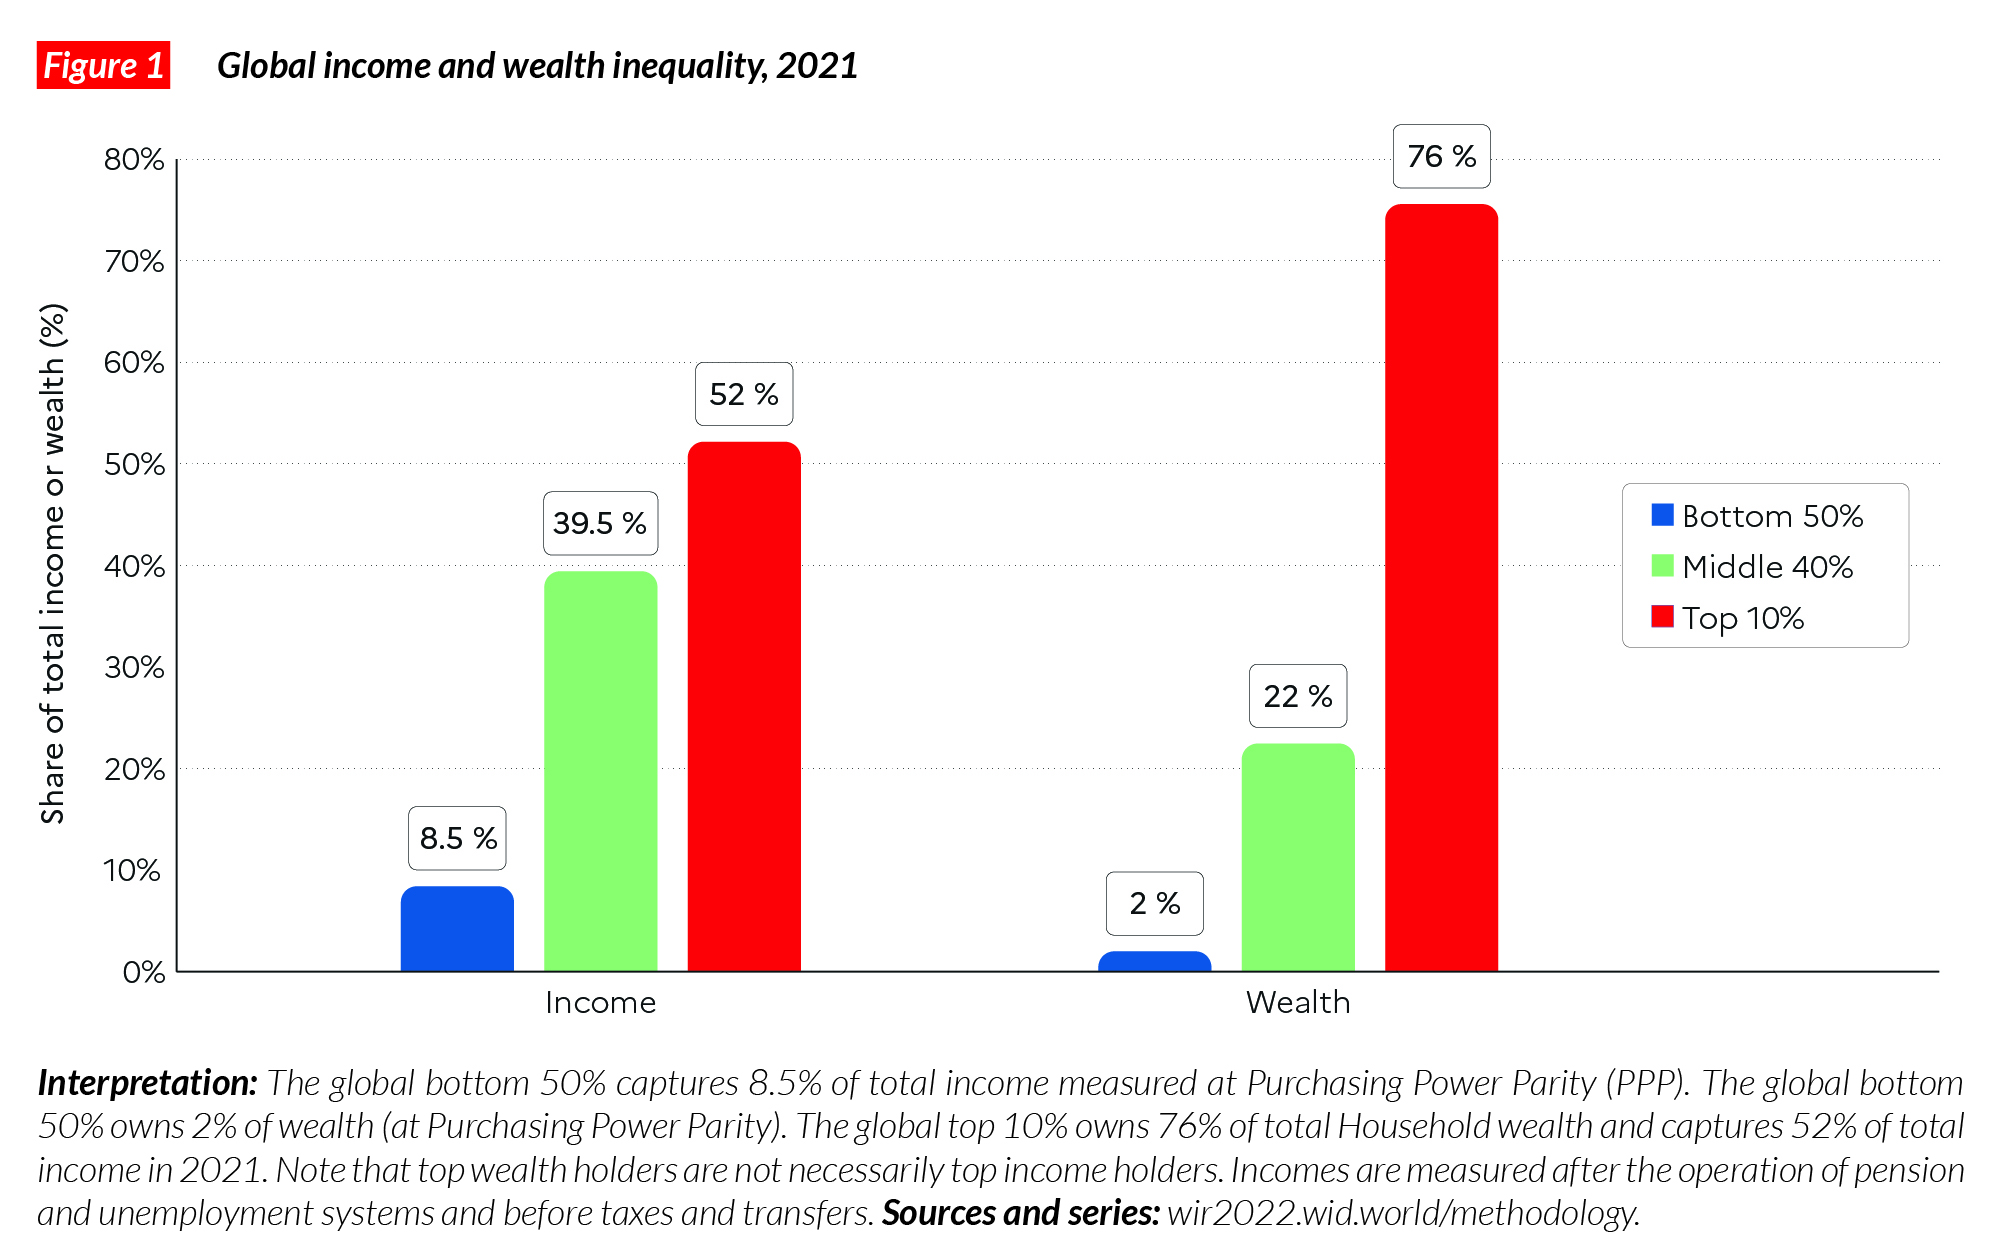
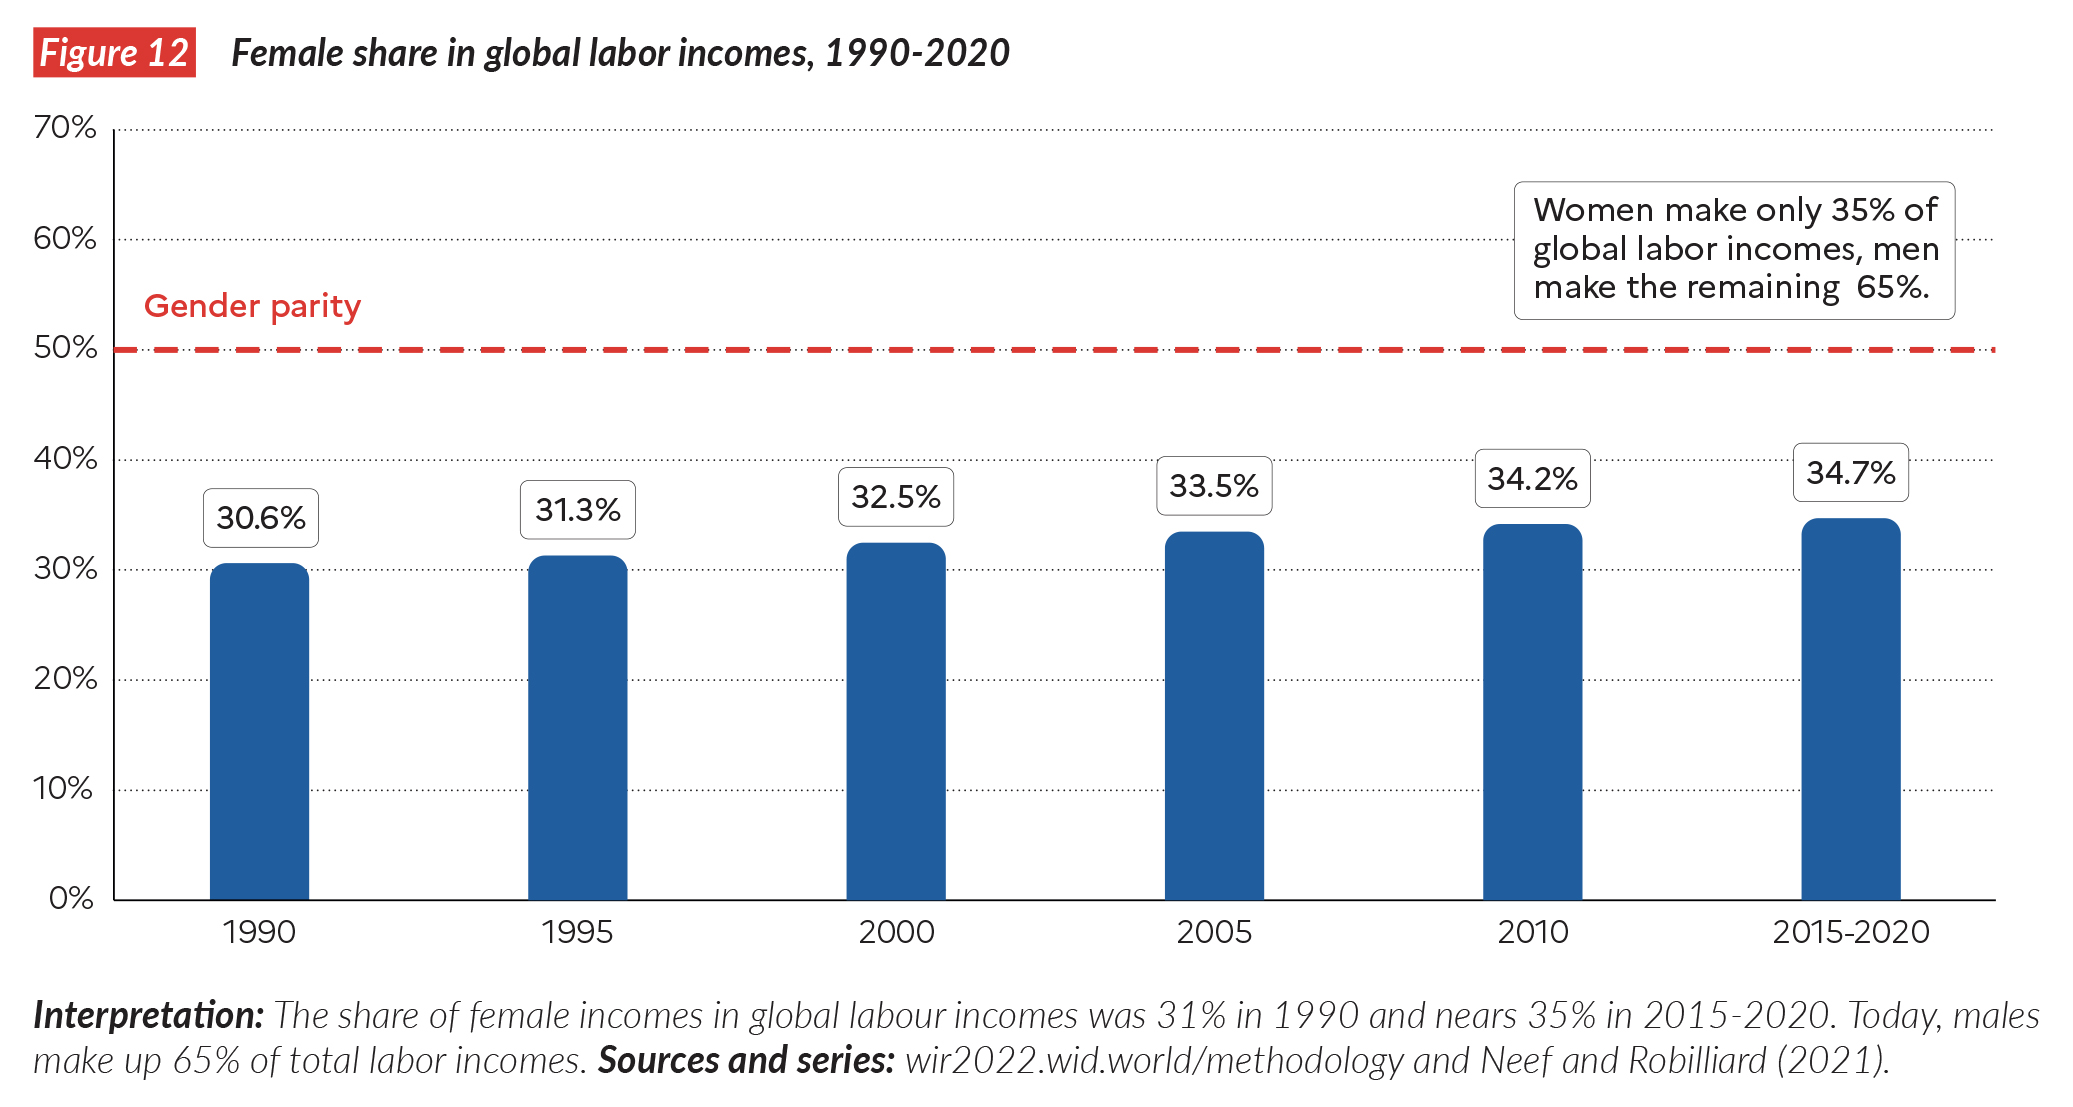
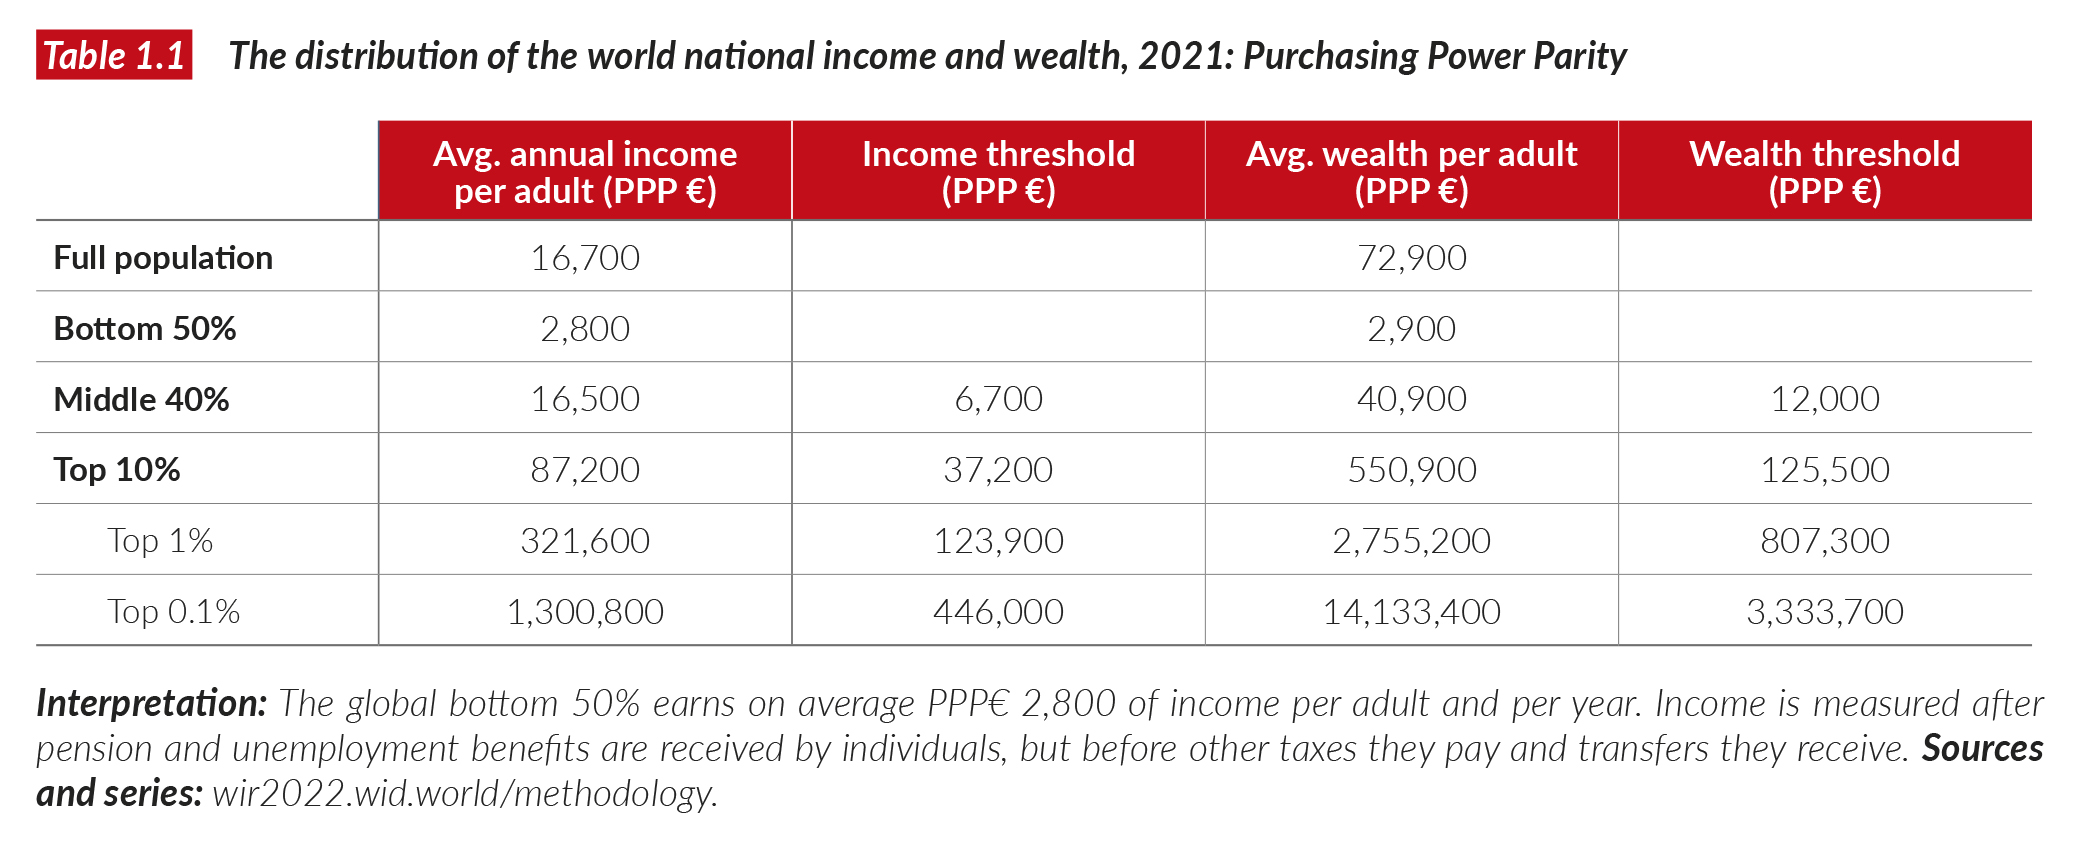
An average adult individual earns PPP€ 16 700 (PPP$23,380) per year in 2021 whereas the average adult owns € 72,900 ($ 102,600) per year. These averages mask wide disparities between and within countries. The richest 10% of the global population currently makes 52% of global incomes, whereas the poorest half of the population makes 8% of it. On average, an individual from the top 10% of the global income distribution earns €87,200 ($122,100) per year, whereas an individual from the poorest half of the global income distribution makes € 2,800 ($ 3,920) per year.
Global wealth inequalities are even more pronounced than income inequalities. The poorest half of the global population barely owns wealth: it owns just 2% of the total. By contrast, the richest 10% of the global population own 76% of all wealth. On average, the poorest half of the population owns PPP € 2,900 per adult, i.e. $ 4,100 and the top 10% own € 550,900 (or $ 771,300) on average.
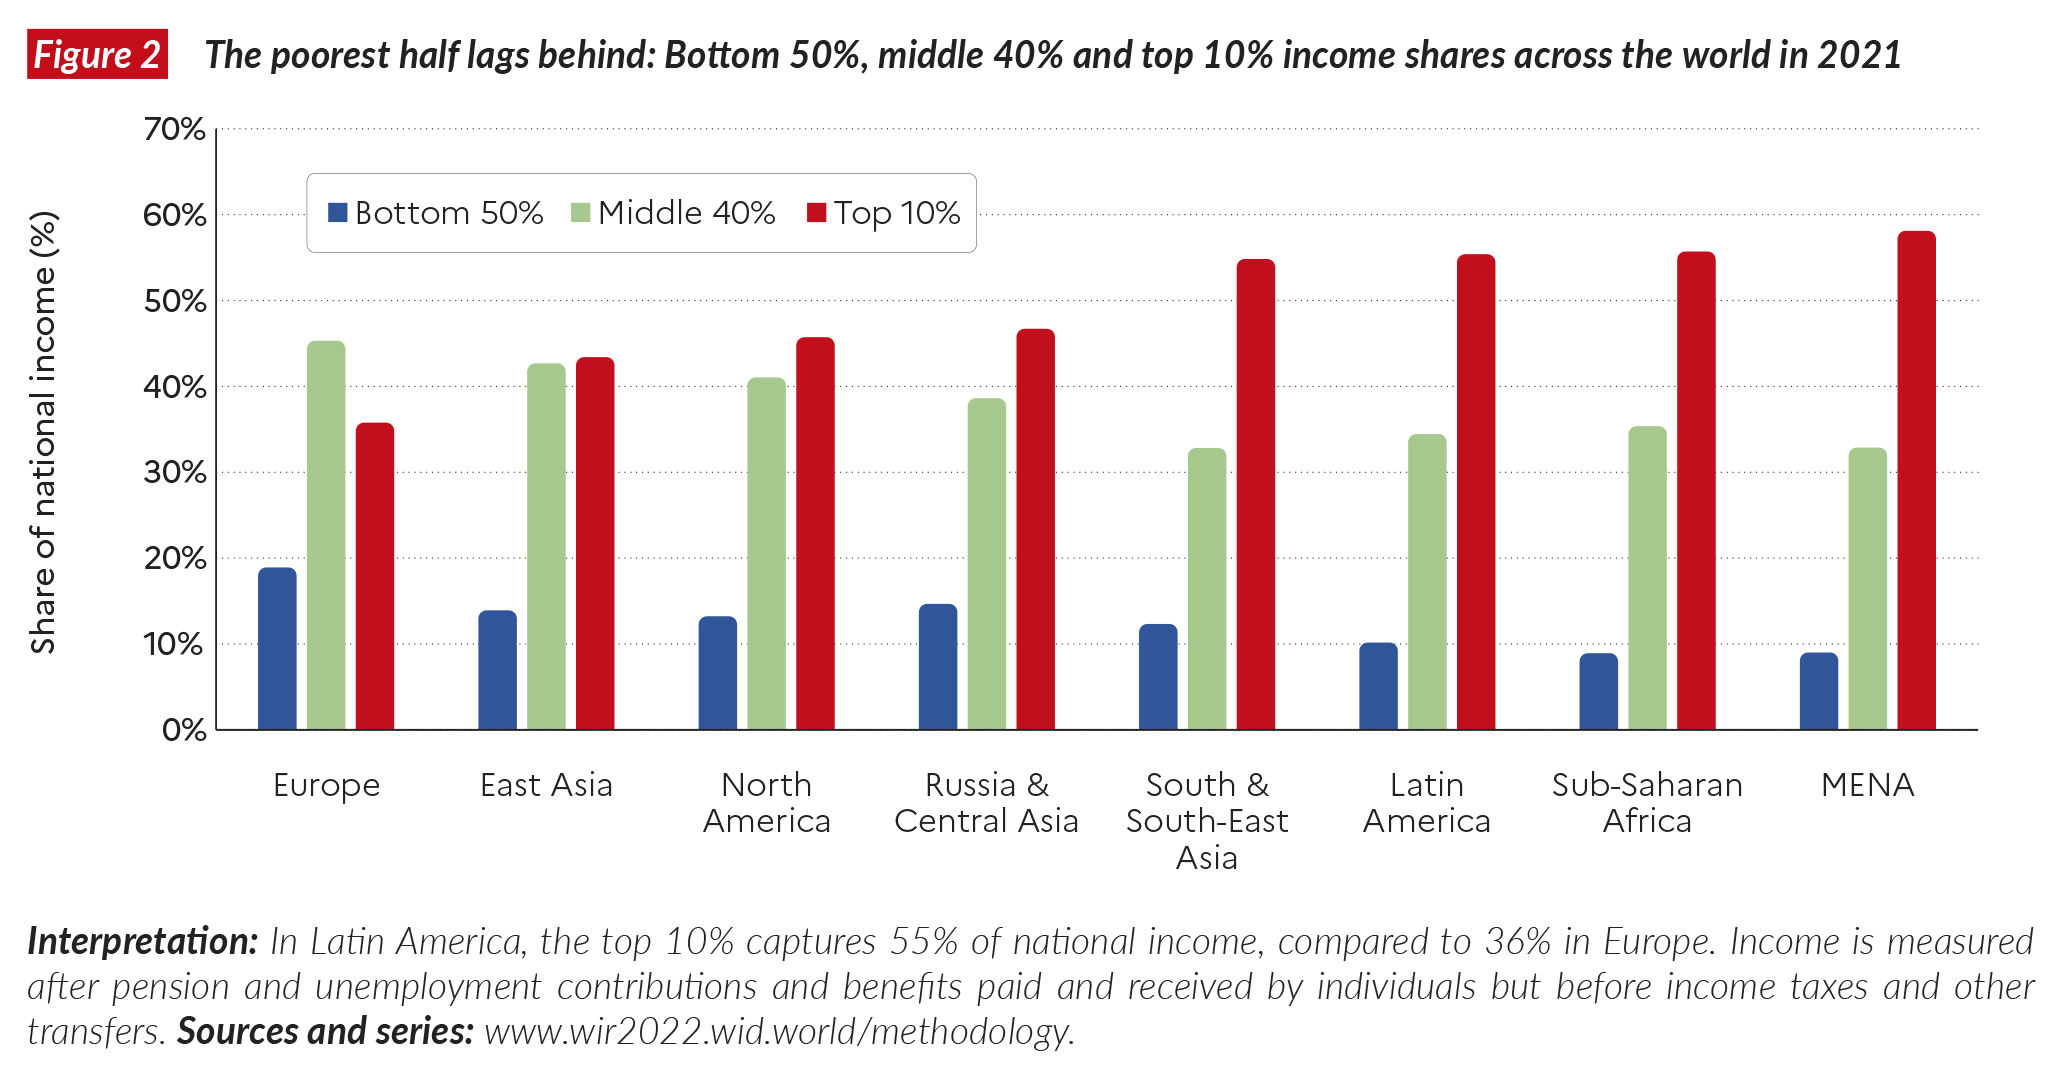
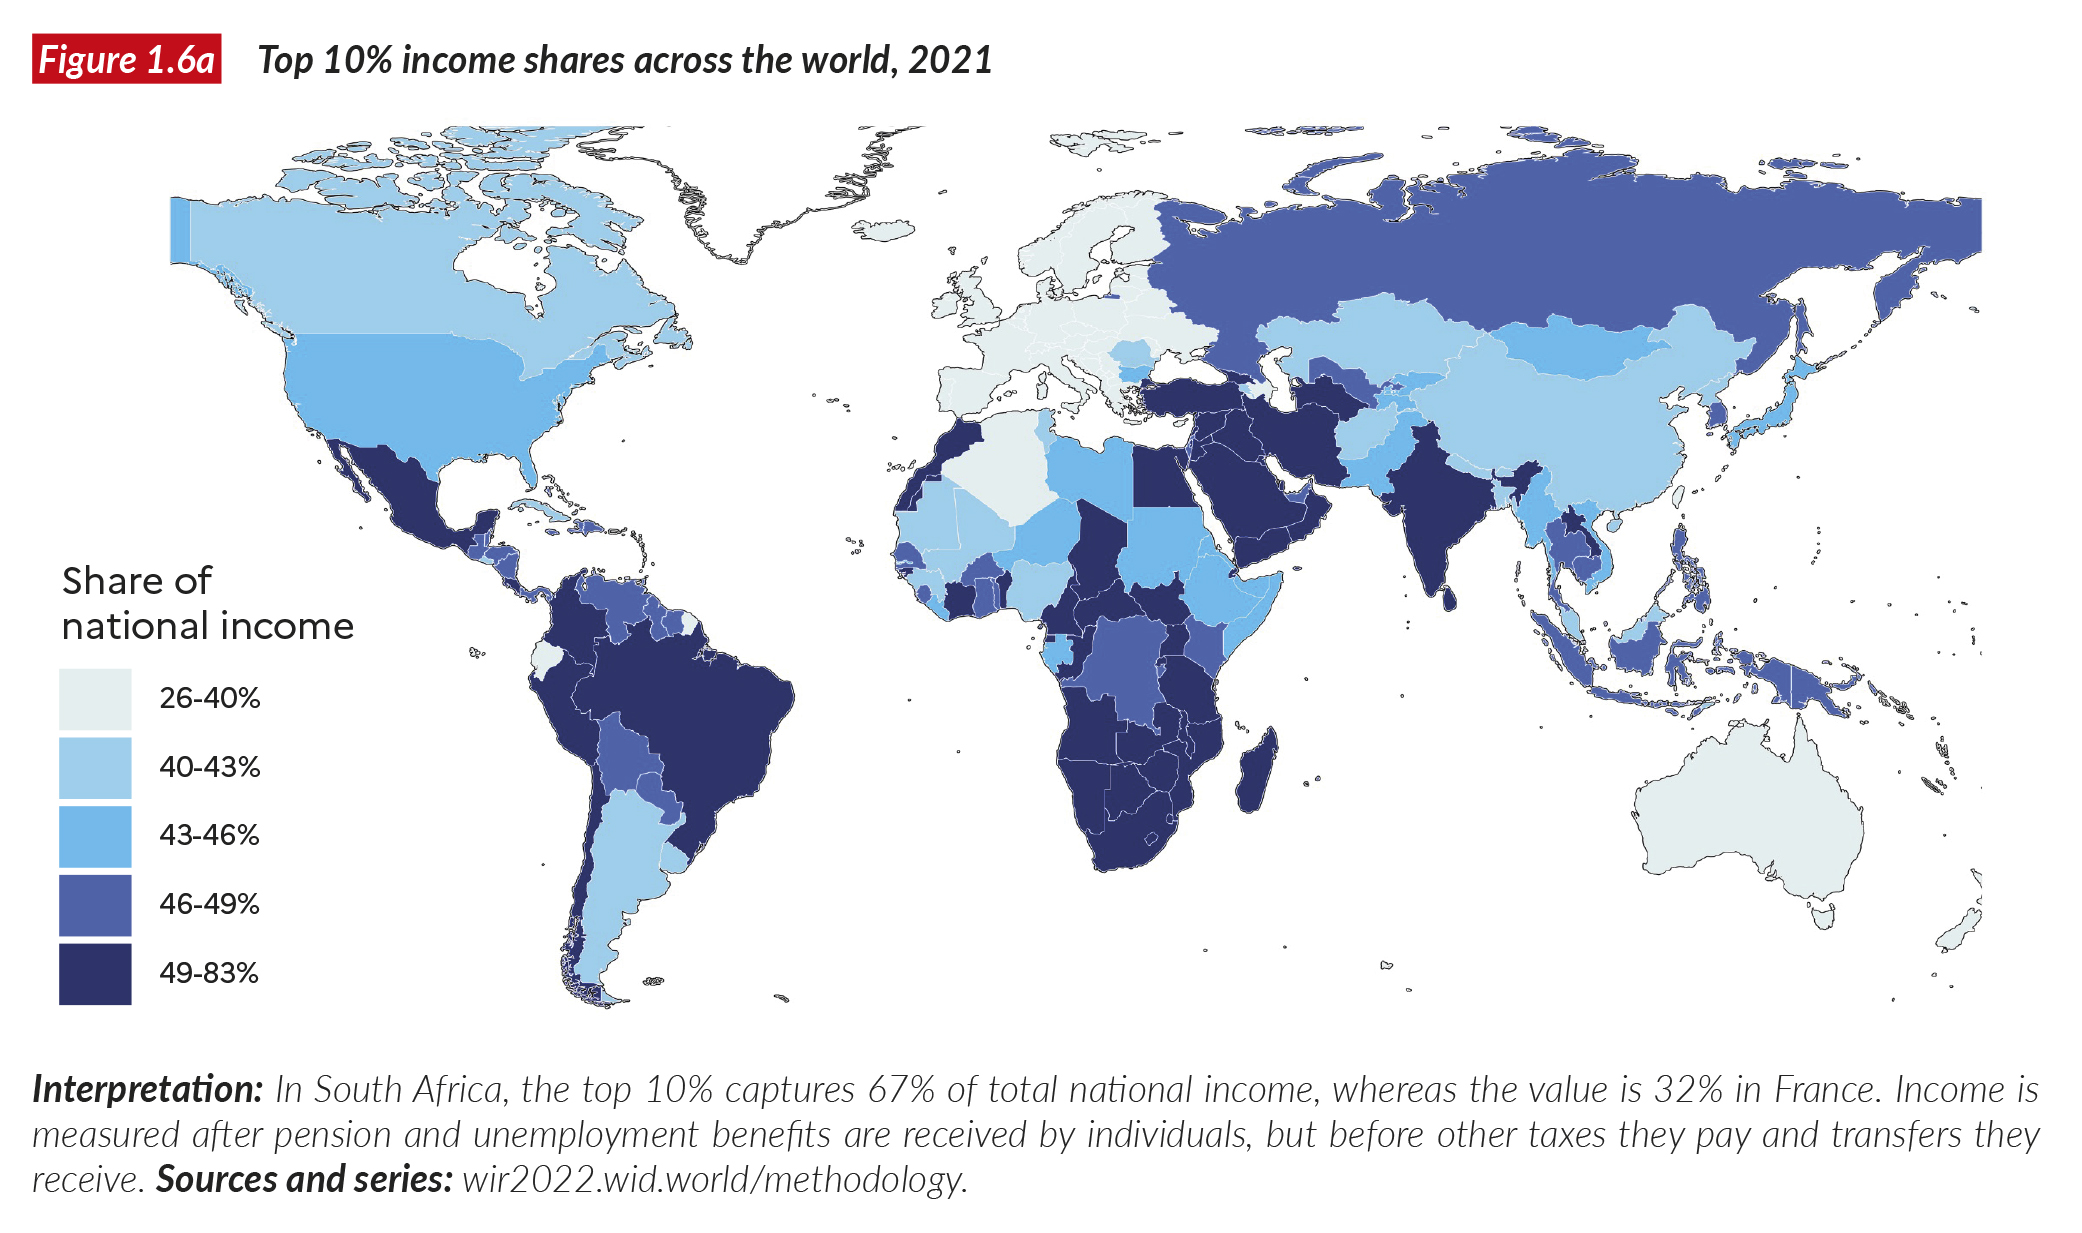
Inequality varies significantly between the most equal region (Europe) and the most unequal region (the Middle East) of the world. In Europe, the top 10% income share is equal to around 36%, whereas in the Middle East it reaches 58%. In between these two bounds, a diversity of patterns are observed. In East Asia, the top 10% makes 43% of total income and in Latin America, 55%.
What is the level of global economic inequality today?
Let us first define two key concepts for measuring economic inequality that we use in this report: national income and national wealth. National income is the sum of all incomes received by individuals residents in a given country over a year. Incomes takes various forms and we typically distinguish two broad sources: incomes stemming from individuals’ labor (e.g. wages or salaries) and incomes stemming from individuals’ wealth (e.g. interest and dividends). National wealth is the sum of the value of all assets owned by individuals in a given country. It is stock resulting from capital accumulation (from savings, i.e. income that has not been consumed) and price effects (see Box 1.3 on Economic concepts, and Chapter 3)1. In 2021, global income amounts to €86 trillion ($122 trillion), while global net wealth amounts to six times this value, €510 trillion2 Global average income per adult in 2021 is €16,700 or PPP €1,390 per month (respectively $23,380 and $1,950), while the average adult individual owns €72,900 ($102,600) in wealth (or €98,600, i.e. $139,000, when all public assets and private non-profit assets are included).3 These average values mask significant inequalities between countries and between citizens.
Global income and wealth inequality between individuals: initial insights
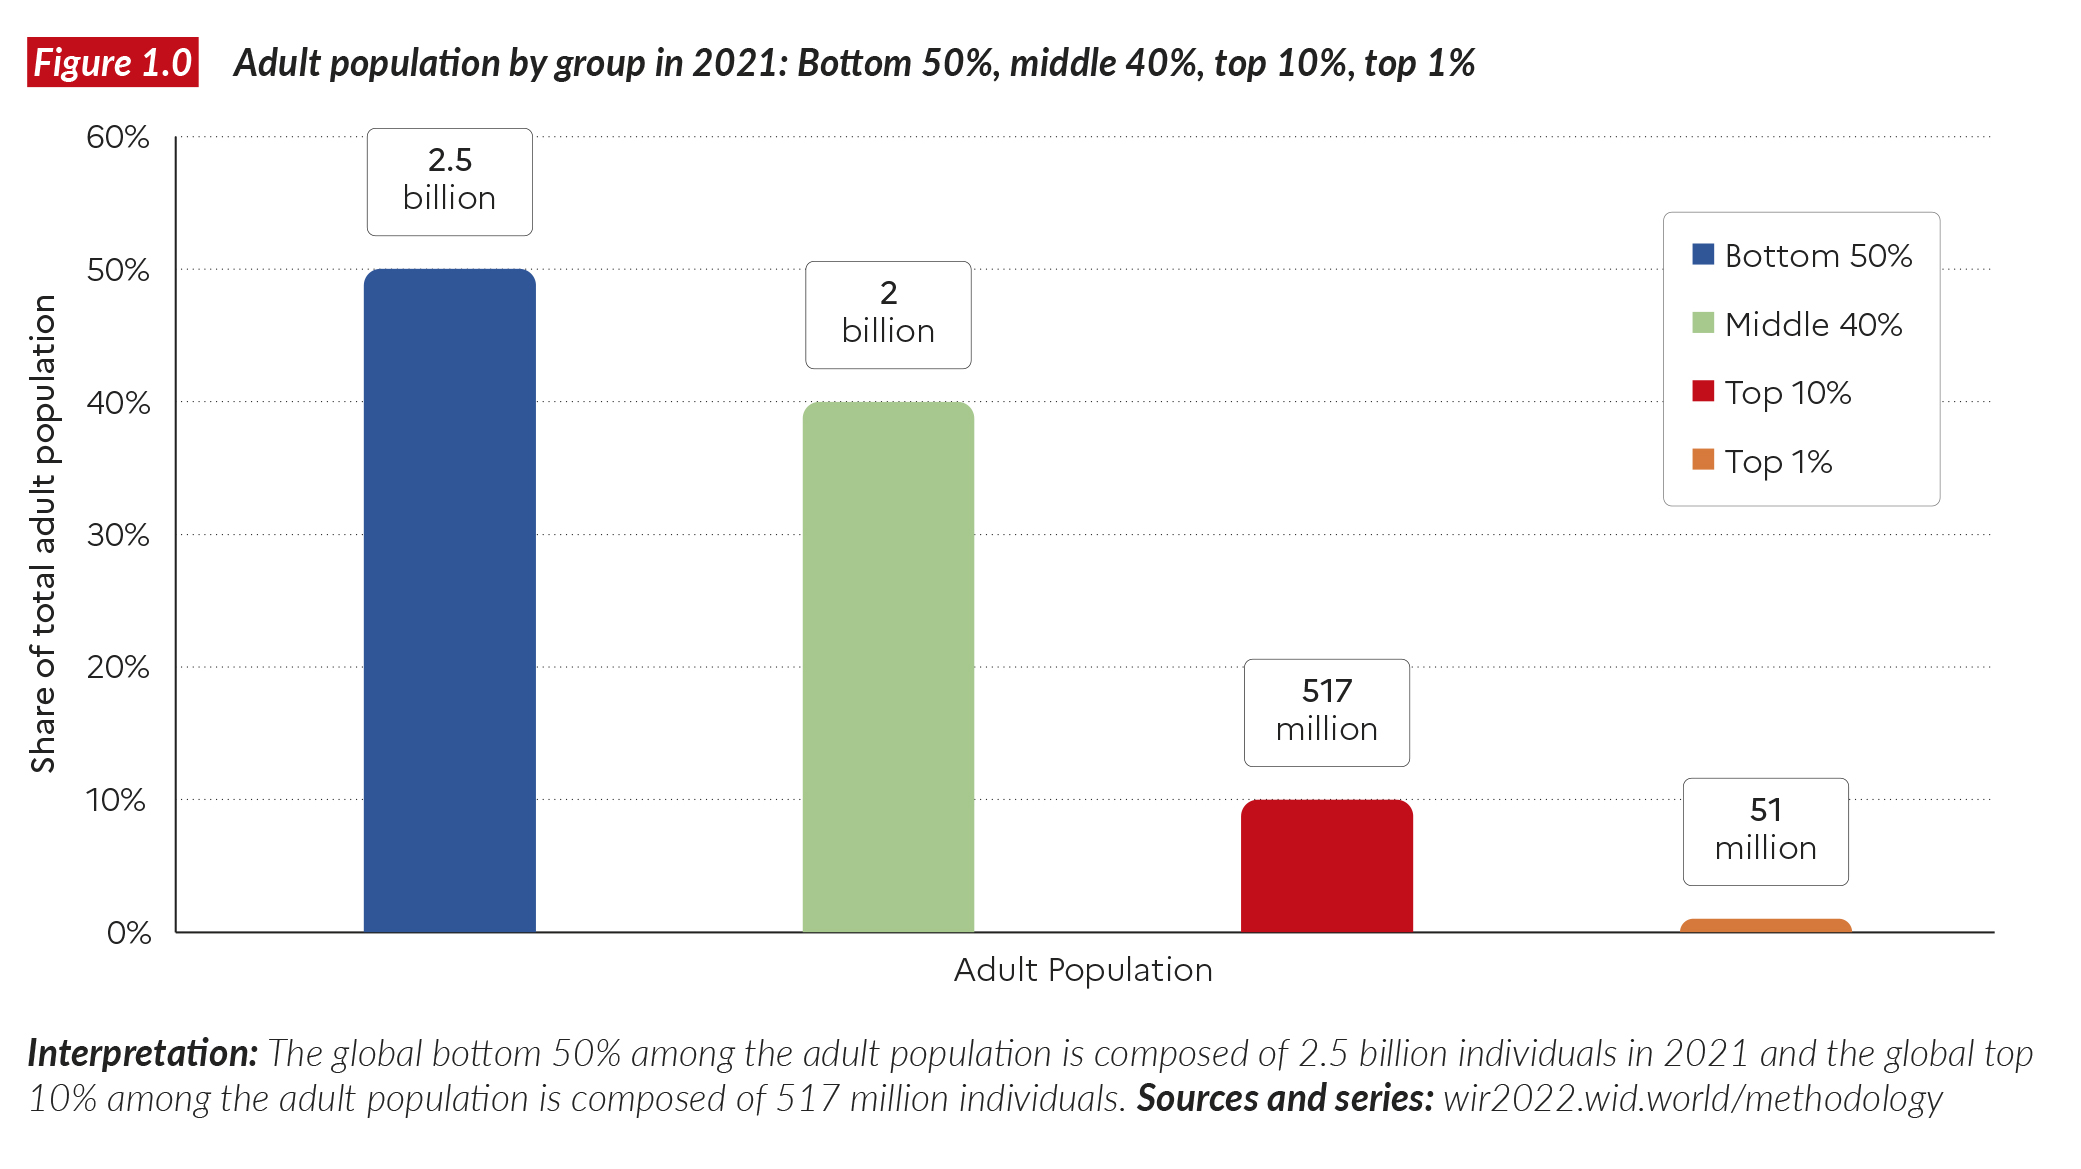
A straightforward way to describe the extent of global inequality is to focus on the shares of income captured by different groups of individuals in the distribution of income across the world. All the statistics presented in this report focus on the distribution of income or wealth across the global adult population of 5.1 billion individuals as of 2021, out of a world population of 7.8 billion when we include children4 In most statistics presented here, we split income and wealth equally across married couples5 The bottom 50% of the adult population, or the poorest half of the world population, today consists of 2.5 billion individual adults. The middle 40% represents the population earning more than the bottom 50% but less than the top 10%; it is made up of two billion individual adults. The global top 10% represents one tenth of the world population, i.e. 517 million individual adults. The global top 1% comprises the richest 51 million individual adults (Figure 1.0).
If all incomes were split perfectly equally across the world, i.e. if everybody earned €16,700 per year, then the global bottom 50% would capture 50% of global income and the global top 10% would capture exactly 10% of the total. Conversely, at maximum inequality, the global bottom 50% would capture 0% of the total and the global top 10% would capture 100% of it. These two situations are the extreme boundaries of global inequality. These levels of inequality have never been reported anywhere in the world and arguably never will be, but they provide a useful benchmark to help us to understand past and present levels of inequality observed within countries, and at the level of the world as a whole.
In practice, the global bottom 50% captures a very small share of global income, just 8.5%. This means that, on average, the bottom 50% earns slightly less than one fifth of the global average, i.e. just €2,800 per year or €230 per month. The global middle 40% earns 39.5% of the total: its income is very close to the global average, at €16,500 per year (€1,375 per month) 6 The global top 10% earns 52% of the total, which is slightly over five times the global average. Its average income per adult amounts to €87,200 per year or €7,300 per month. As we can see already, the world seems closer in 2020-2021 to the absolute inequality benchmark described above than to the absolute equality benchmark (see Table 1.1).
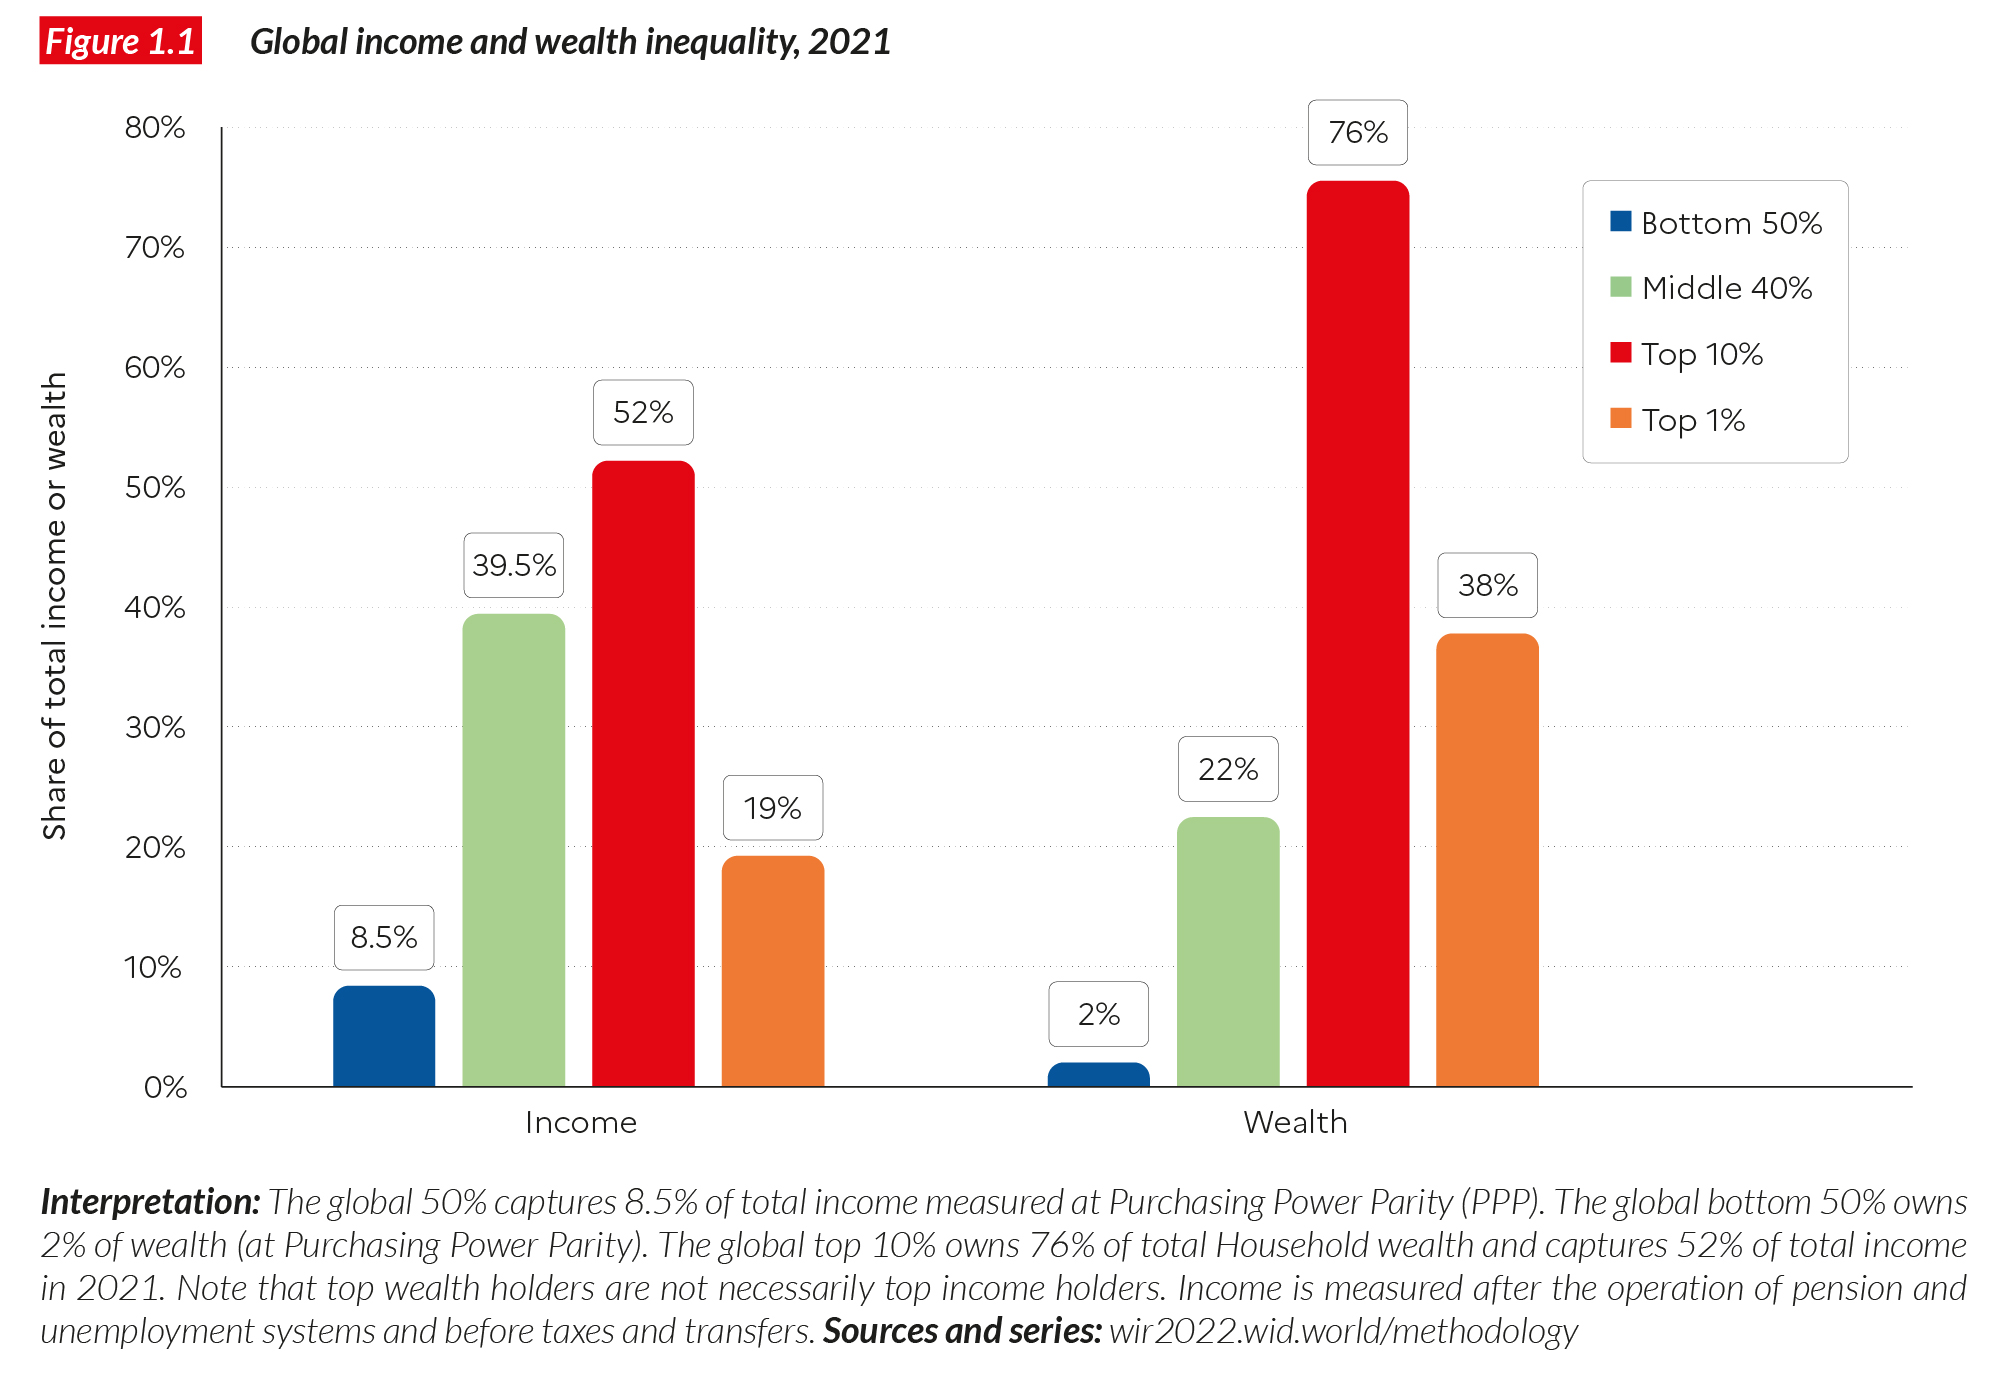
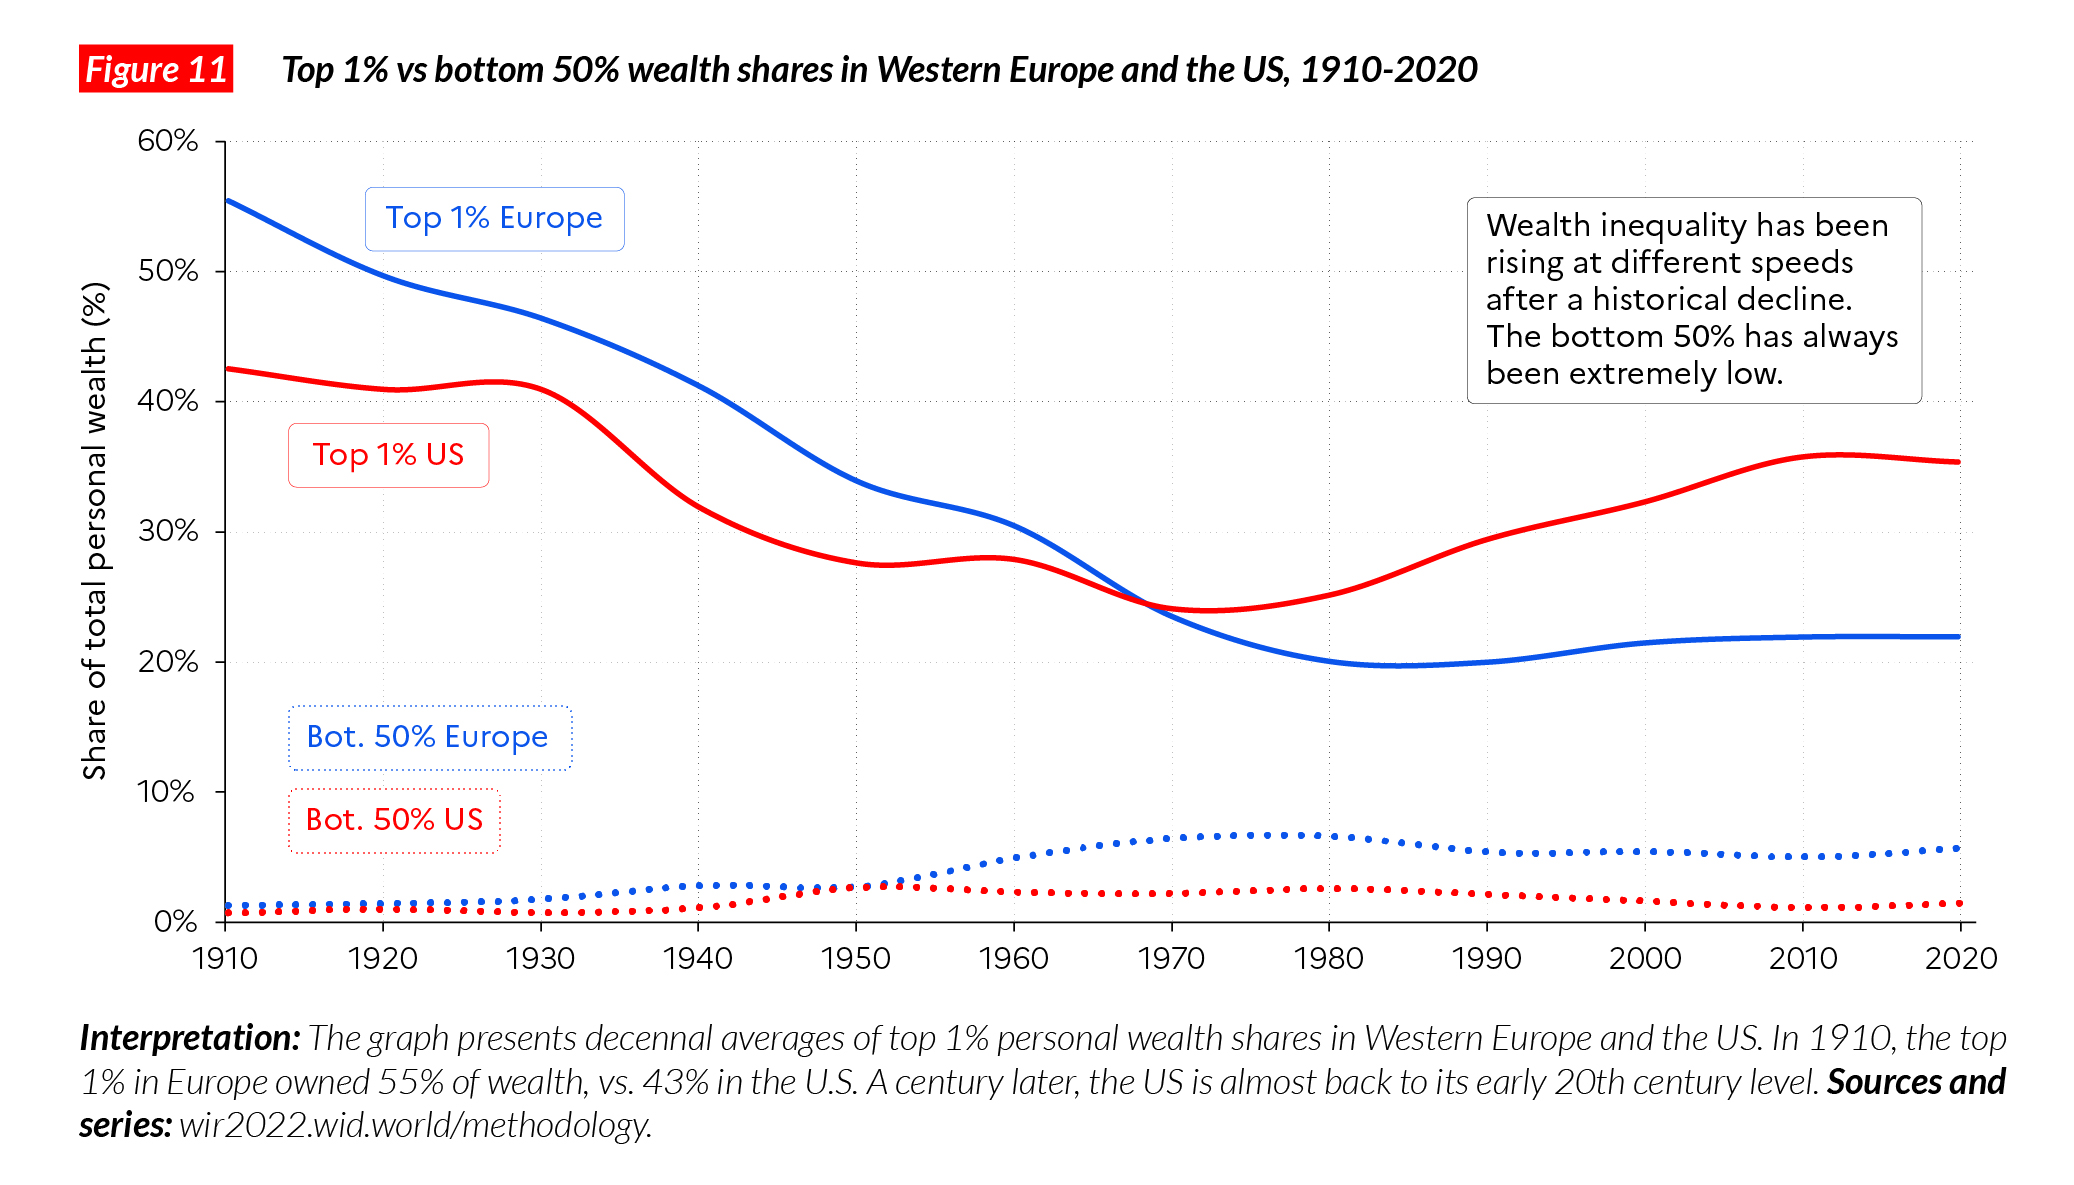
Global wealth appears to be even more unequally distributed than global income. The poorest half of the world population owns just 2% of total net wealth, whereas the richest half owns 98% of all the wealth on earth. The bottom 50% owns, on average, €2,900 of assets (typically in the form of land, housing, deposits or cash). Between the richest half of the global population, the middle 40% owns just 22% of total wealth (on average €40,900 per adult) and the top 10% owns 76% (i.e. €550,900 per adult, on average, including a large share of financial wealth such as stocks and bonds) (see Table 1.1). We should note that when we measure global wealth inequality using market exchange rates, rather than purchasing power parities (see Box 1.3), then there is even more inequality: the global bottom 50% owns less than 1% of total wealth and the global top 10% nearly 82% of it. To summarize: as we write, the world is marked by a very high level of income inequality and an extreme level of wealth inequality. In Chapter 2, we show that beyond relatively small variations over the recent period, these extreme inequality levels persisted over the entire 1910-2020 period, despite profound transformations of the world economy over the past 100 years.
Global income and wealth inequality between countries
Global income and wealth inequality between individuals have two components: inequality between countries and regions (i.e. average income differences between, say, Indians and Germans) and inequality within countries (i.e. income differences between, say, rich and poor Indians). Let us be clear: in the contemporary global economy, these two components of inequality are very substantial. Inequality within countries is at a historic high today (see Chapter 2), and inequality between countries remain particularly high despite the emerging world catching up somewhat over the past four decades.
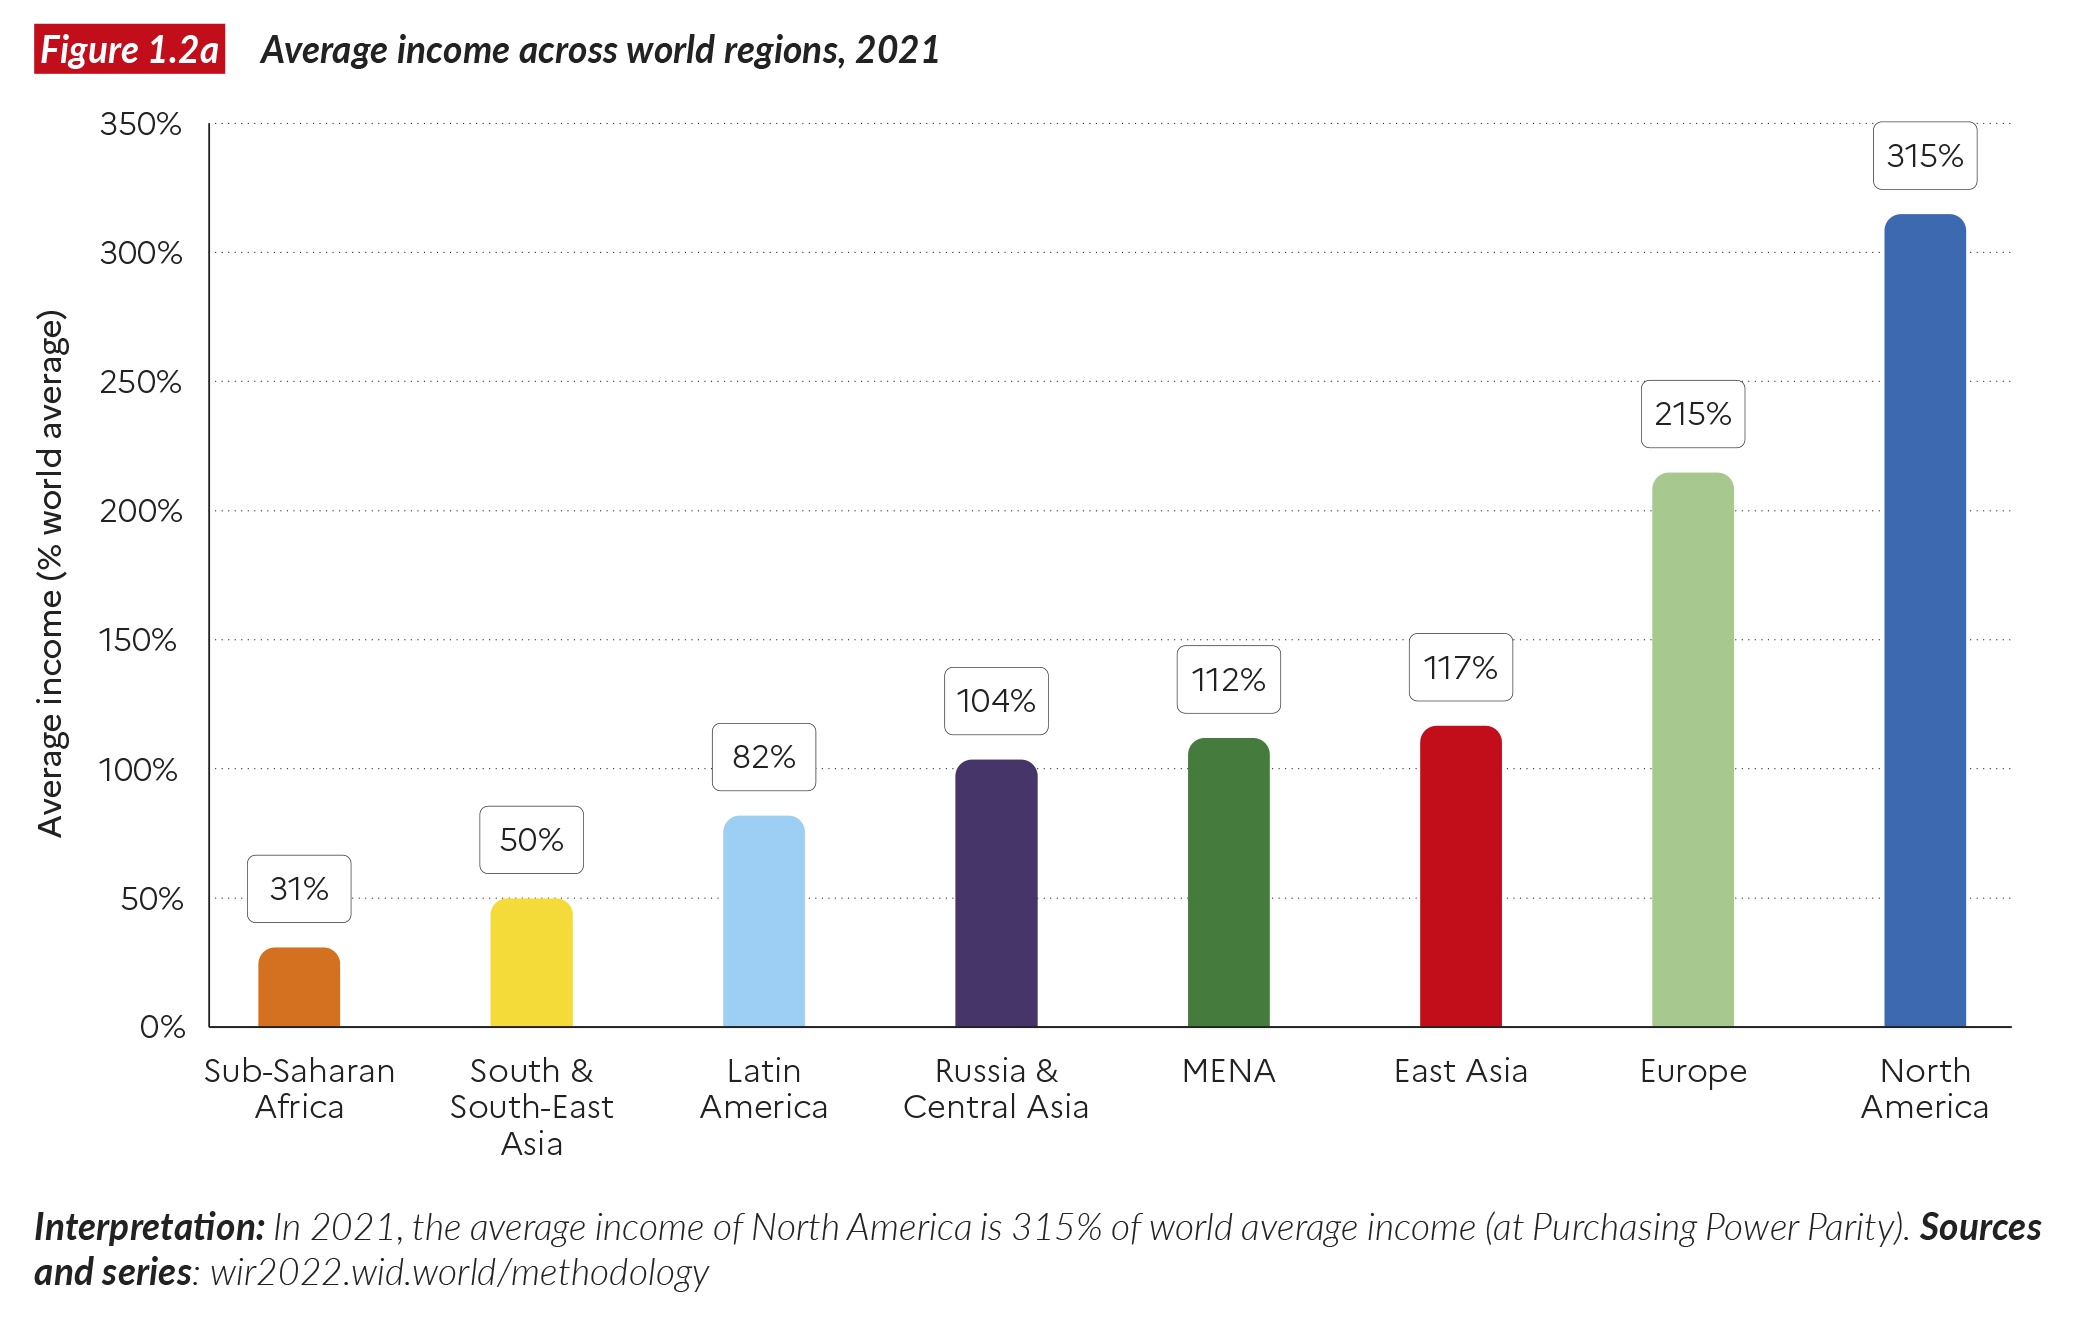
What is the degree of inequality between world regions? We present key insights below. Figure 1.2a presents average incomes across world regions, expressed as a percentage of the global average income of €16,700 per year. Average income in Sub-Saharan Africa is 0.3, i.e. 31% of the global average, and in South and Southeast Asia it is 0.5, i.e. 50% of the global average. Latin America, East Asia, and Russia and Central Asia have average incomes at or near the global average. In Europe, the ratio is more than twice the global average (215%), and in North America it is three times the global average. This means that North Americans earn 6 to 10 times more, on average, than Sub-Saharan Africans, South and Southeast Asians, while East Asians earn half of what Europeans earn. Again, recall that these incomes are all expressed in purchasing power parity and not market exchange rates.
If we were to look at income earned per hour worked, the gap observed between rich and poor countries would be even wider (because Sub-Saharan Africans and Southeast Asians spend around 30% more time at work per year than Europeans and North Americans), and the difference in hourly income between Europeans and North Americans would be 30% lower because North Americans work longer hours7 This is the first note of caution: incomes are a powerful economic indicator of living standards, but must be complemented by other indicators (time spent at work, quality of public services and infrastructure, quality of civic and human rights, environmental quality, etc.) if they are to be a good representation of inequalities in living standards between countries. There is no silver bullet indicator for measuring inequality across nations and individuals across the world. We will come back to several of these complementary dimensions of inequality in the following chapters of this report.
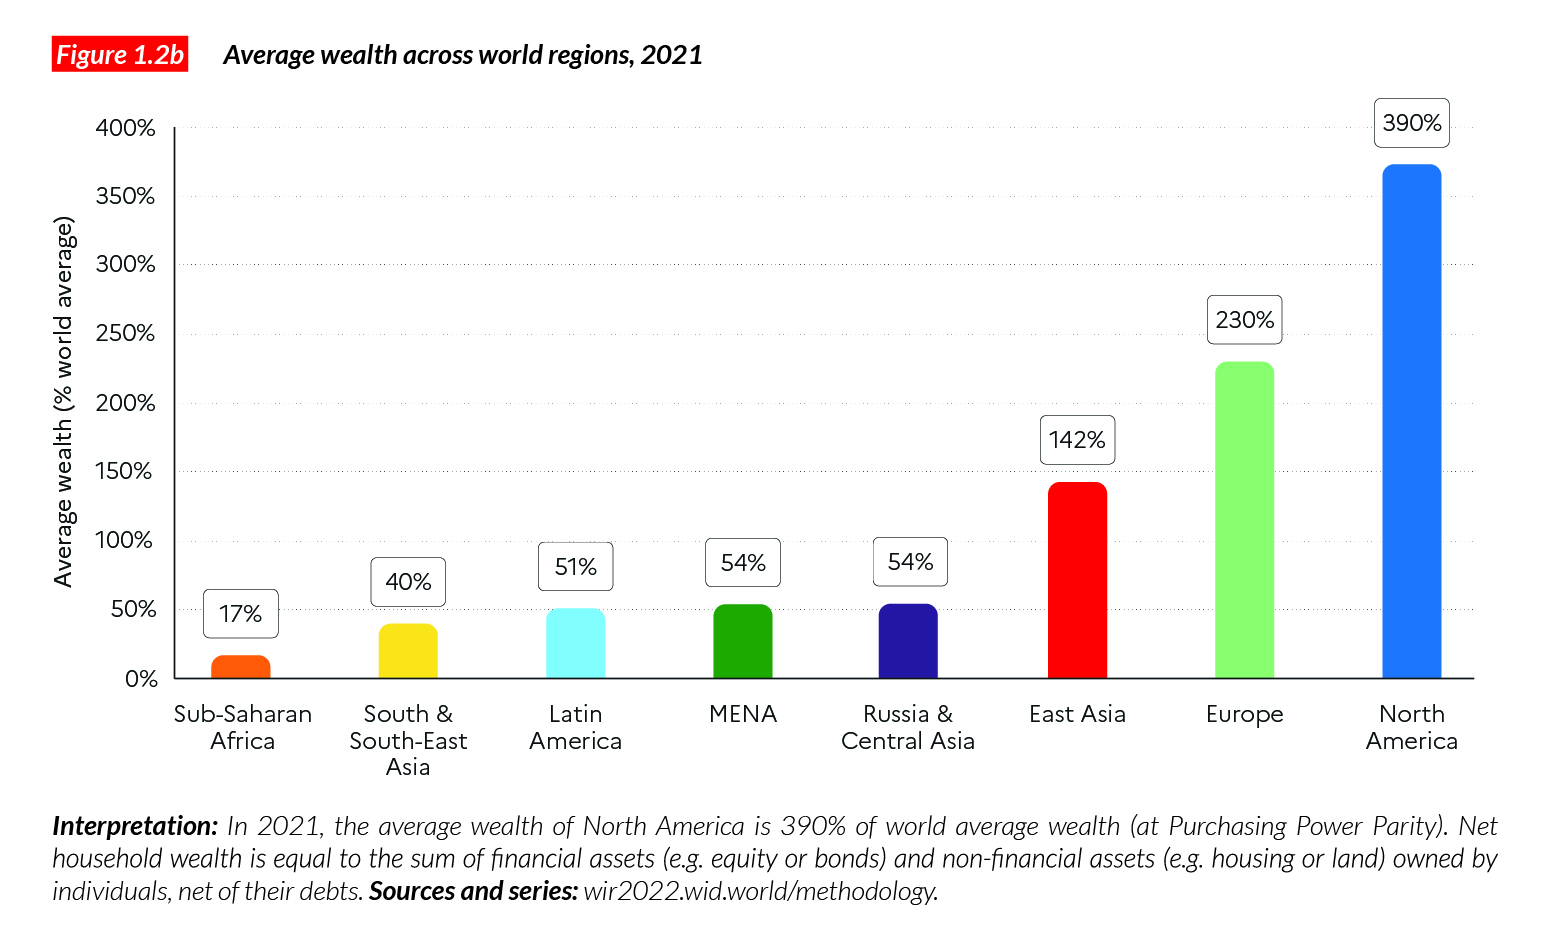
Turning to wealth inequalities between world regions: it appears that wealth disparities between rich and poor regions are greater than income disparities. Poor regions are relatively poorer in terms of wealth: Sub-Saharan Africans, South and Southeast Asians and Latin Americans own just 20-50% of the global average (compared with 50%- 100% for income) as shown in Figure 1.2b. It should be noted that for a given amount of capital, poor regions generate relatively more income than richer ones. It is sometimes argued that poor countries are poor because they use their capital resources inefficiently. This is incorrect: poor countries are relatively efficient in their use of capital but have very little capital to start with. We discuss the various causes of global inequality between countries in Chapter 2.
Income inequality varies significantly across regions
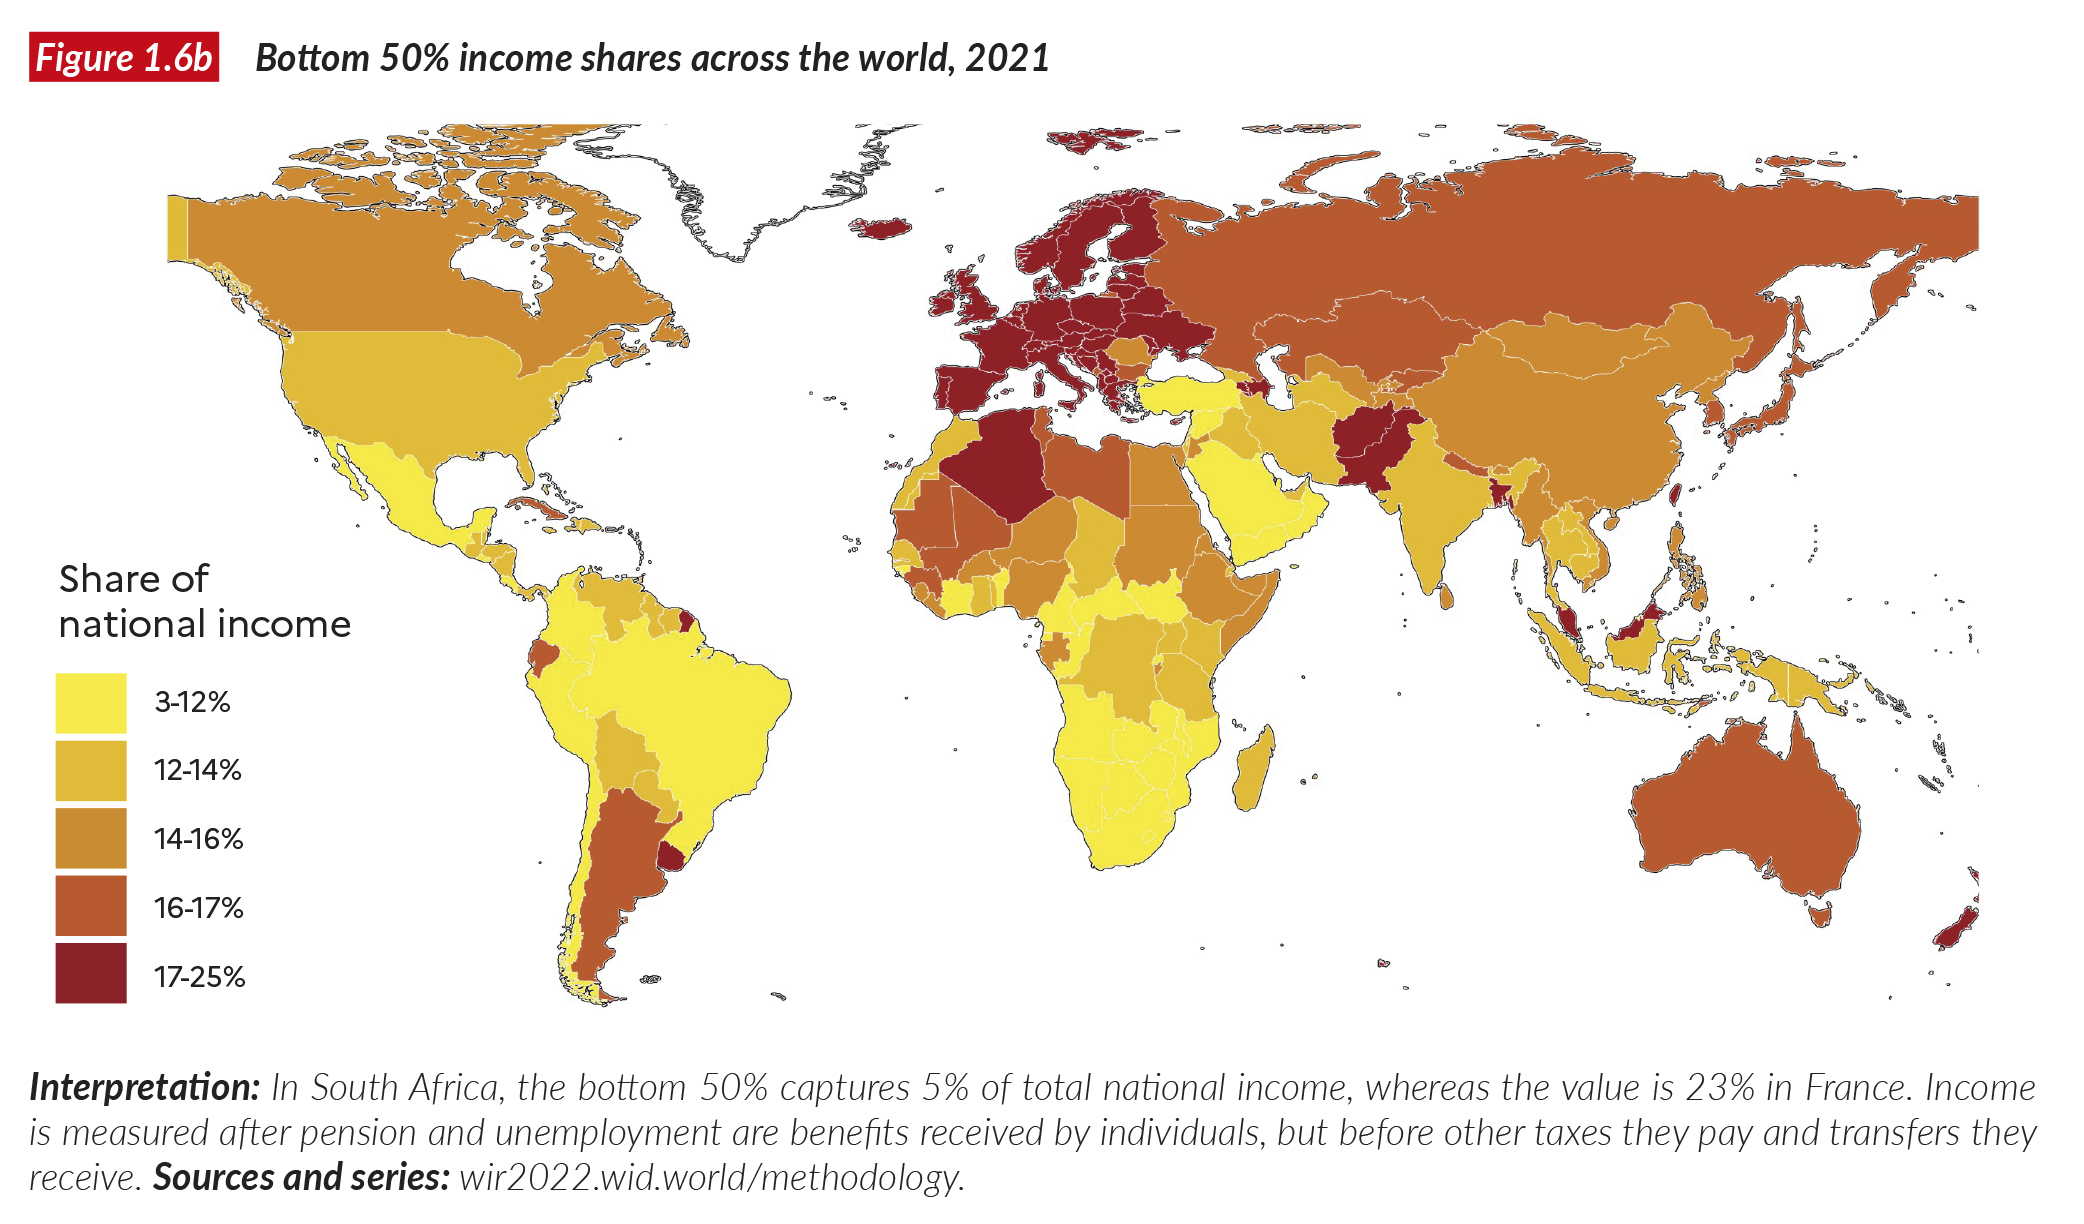
Let us now turn to economic inequality within countries and regions. Figure 1.3 presents the top 10%, middle 40% and bottom 50% national income shares for various regions of the world. Nowhere in any of these regions does the bottom 50% gain above 20% or under 9-10%, meaning that it systematically earns between 40% and around 20% of the average. Regions with the smallest bottom 50% shares are Latin America, the Middle East and North Africa, Sub-Saharan Africa and South and Southeast Asia, where the bottom 50% captures 9-12% of national income. In these regions, inequality levels are on par with inequality levels recorded at the global level. Put differently, there is as much income inequality between world citizens as there is inequality between individuals living within Latin America or within Sub-Saharan Africa. This can be explained by the presence of dual societies within these regions – these are societies with a very affluent economic and political elite that enjoys high-income countries’ levels of prosperity, living next to individuals in extreme poverty. In other world regions, the bottom 50% is not as poor, either relatively absolutely: in North America, East Asia, and Russia and Central Asia, the bottom 50% share is close to 13% and the European bottom 50% captures 19% of national income.
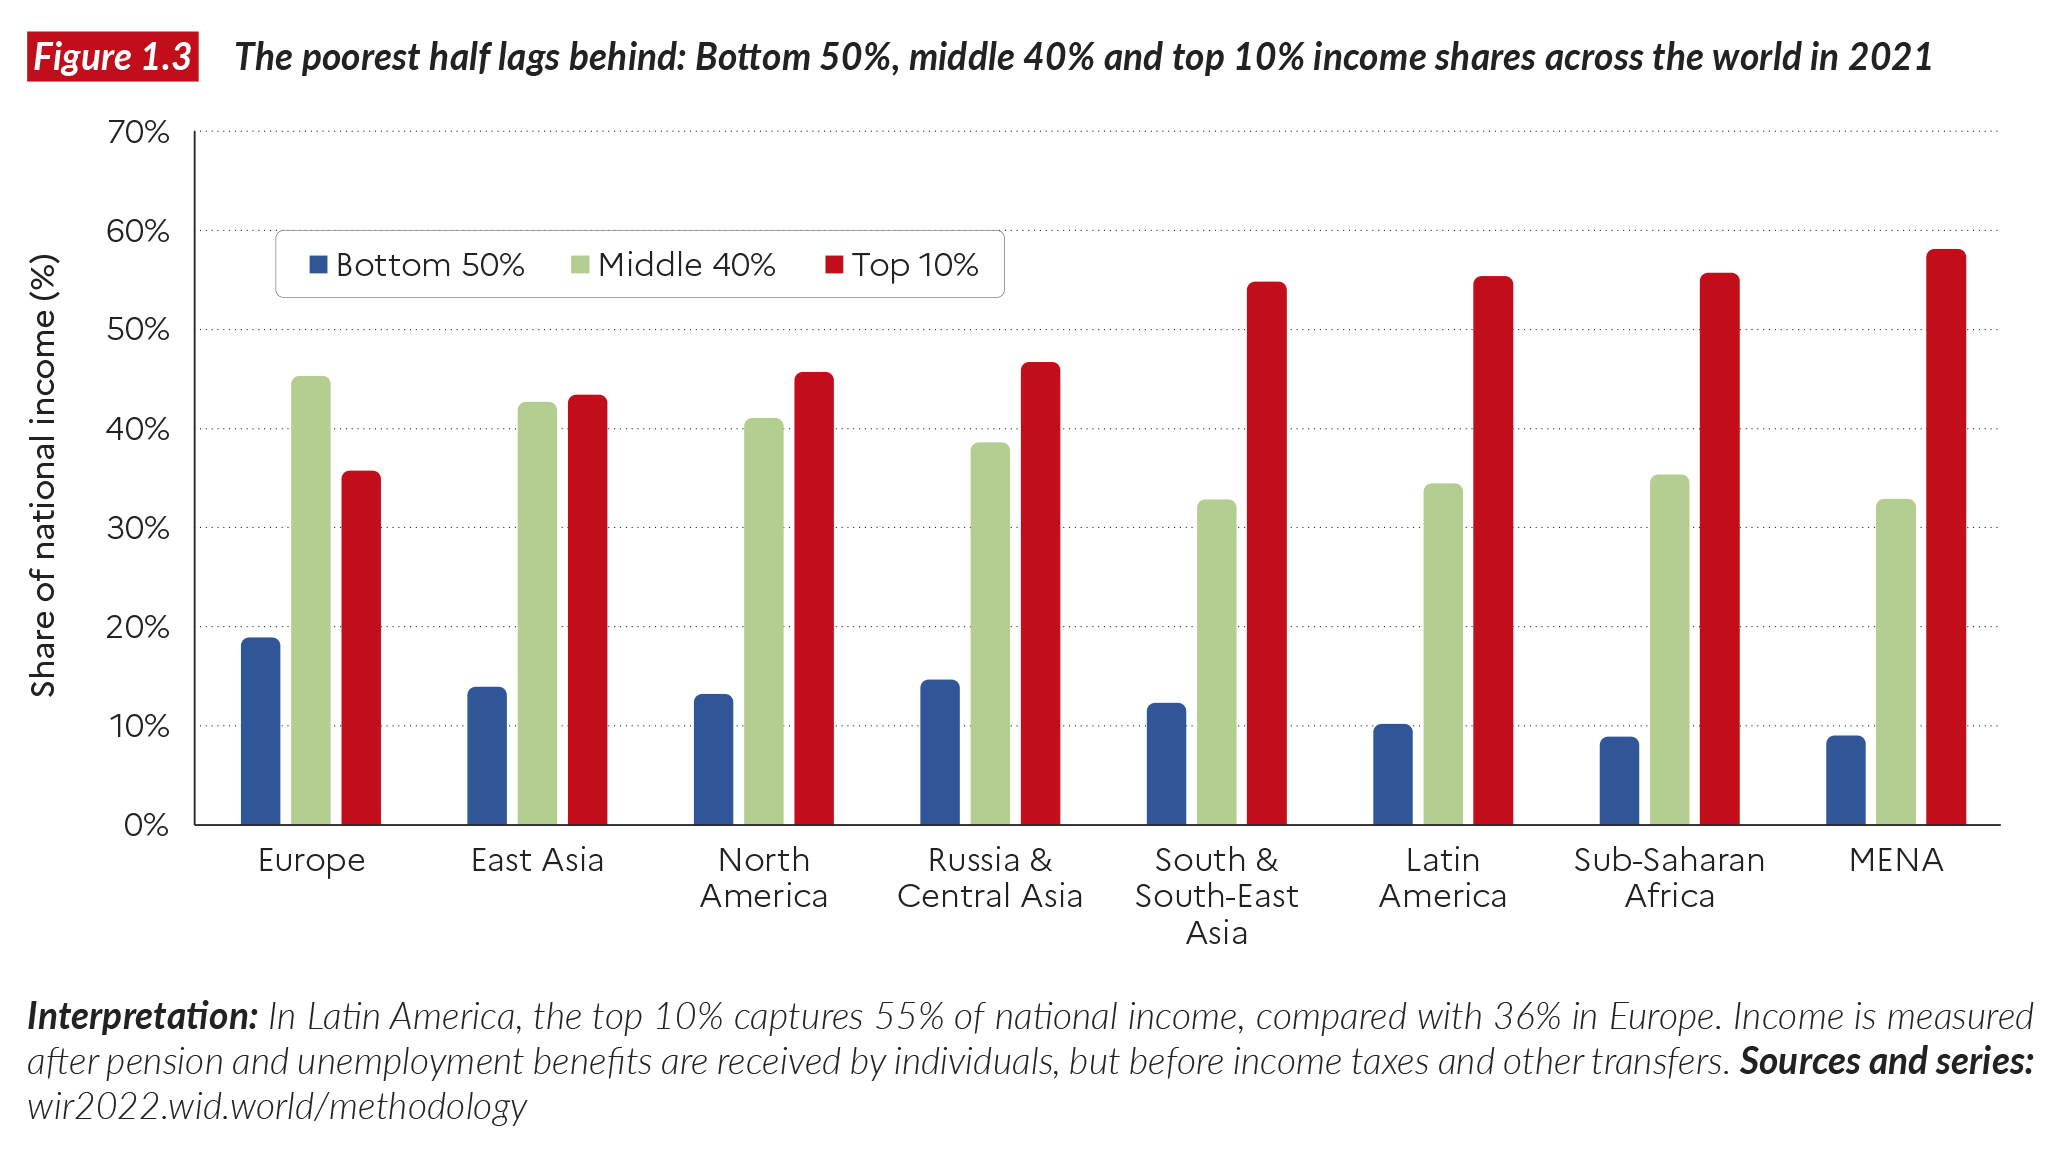
Turning to the other end of the distribution, the top 10% captures 36% of income in Europe while this is 55-58% in the world’s most unequal regions. The ranking of top 10% income shares mirrors the ranking of regions on the relative position of the bottom 50%: regions with very low bottom 50% shares have very high top 10% shares. Europe stands out as a relatively equal region – the only one with a middle 40% (to simplify, a “middle class”) that as a whole earns significantly more than the top 10%.
It is strikingly clear that average standards of living are a particularly unreliable determinant of inequality levels across the world. Europe and North America have broadly similar average incomes, but their inequality levels are markedly different8 the Middle East and North Africa and East Asia also have similar per capita incomes, but very different income distributions. This is a key insight of this Chapter: there is a variety of possible inequality outcomes for any given average standard of living. Put differently, there is no trade-off between higher income levels and higher inequality levels. At the same time, higher average income levels by no means imply less inequality. The degree of inequality within a society is fundamentally a result of political choices: it is determined by how a society decides to organize its economy (i.e. the sets of rights given to and constraints imposed on firms, governments, individuals, and other economic actors).
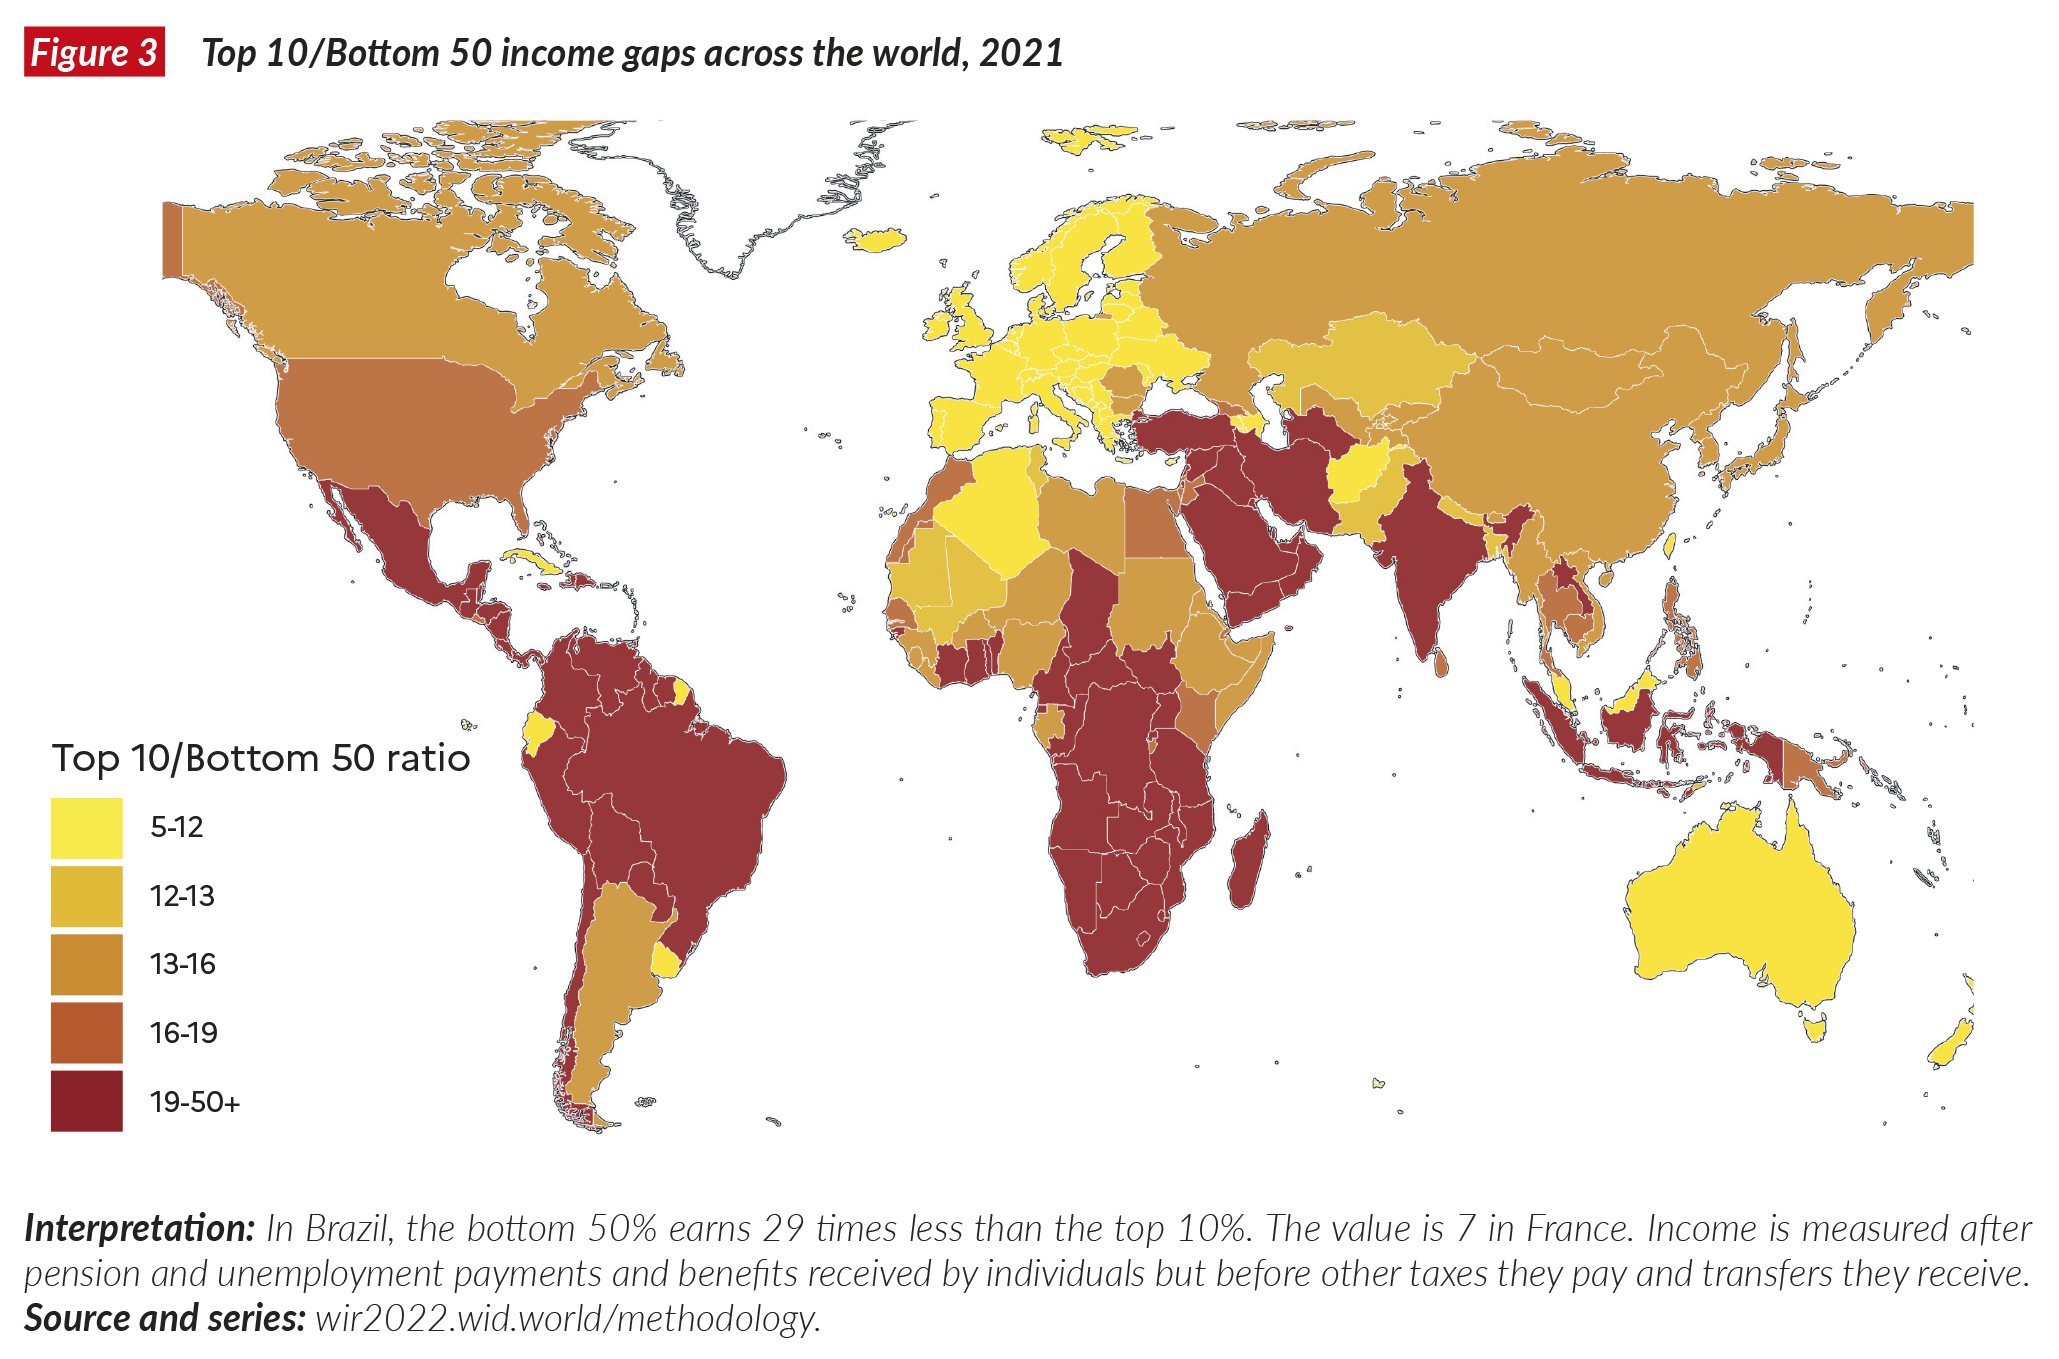
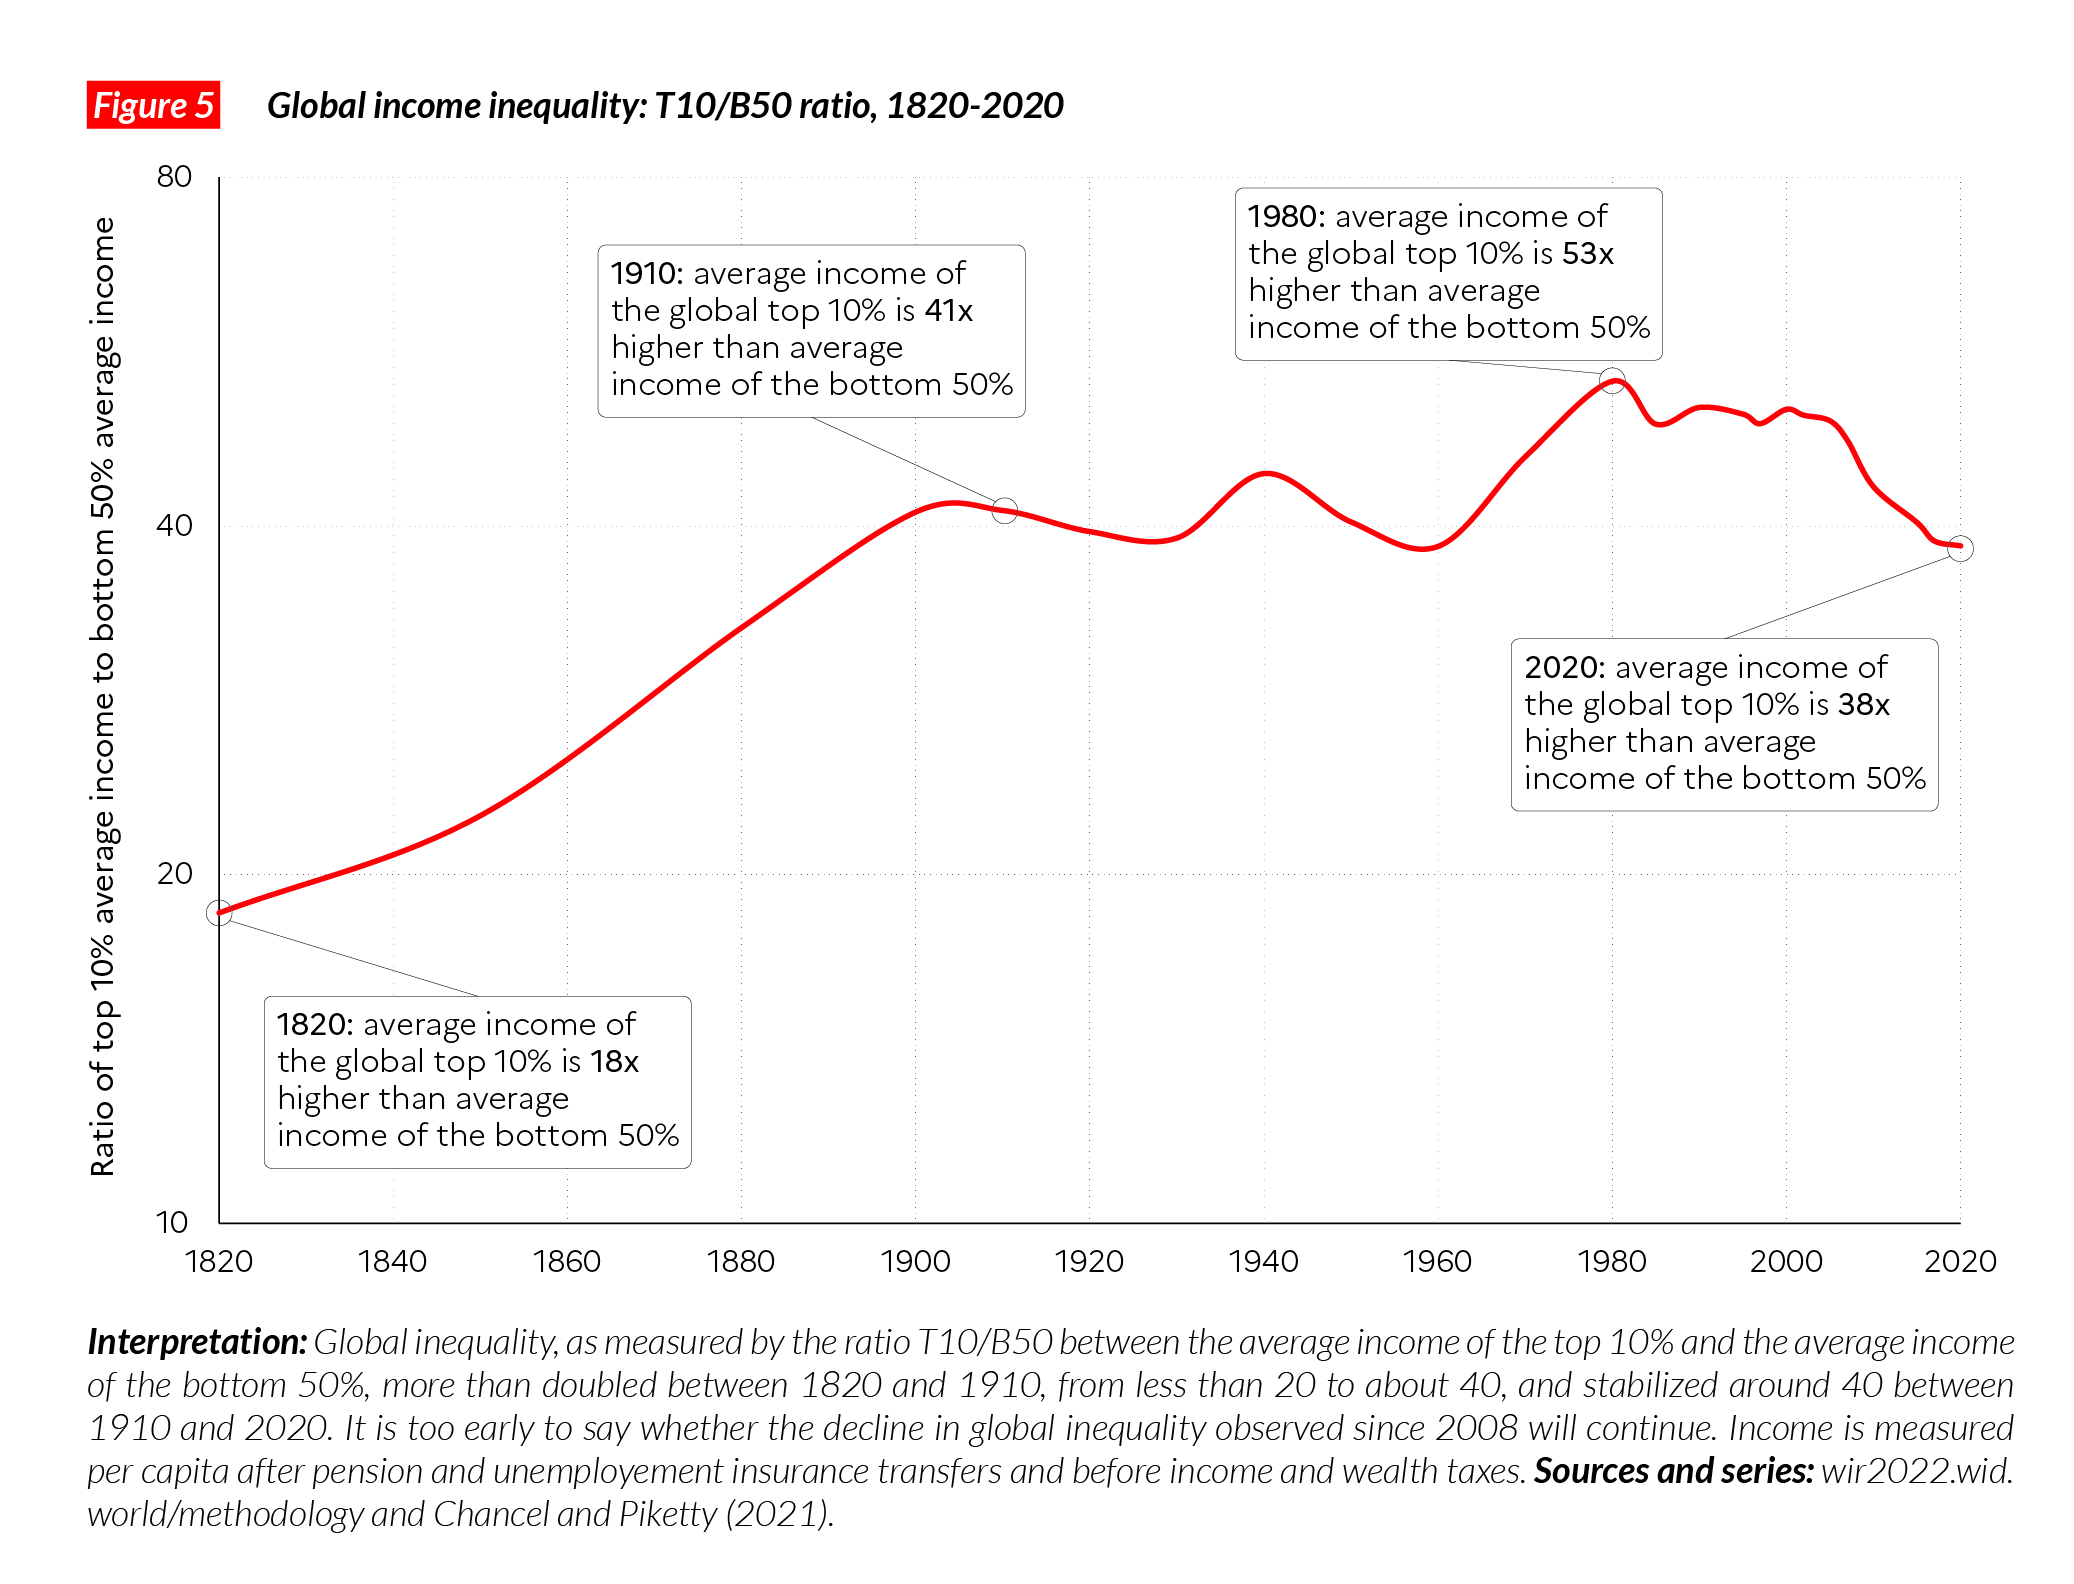
Moving beyond the study of income shares, a simple way to compare overall inequality across countries is to focus on the gap between the top 10% average incomes and the bottom 50% average incomes. This indicator, which we call the Top 10/Bottom 50 (T10/B50) income gap summarizes in a single metric how societies distribute incomes at both ends of the social ladder. Its interpretation is straightforward as it answers a relatively basic question: “How many times more do the rich earn than the poorest half?”
Note that if the top 10% income share were equal to 50% and the bottom 50% income share to 10%, then, as the bottom 50% is five times greater in number than the top 10%, the T10/B50 income gap would be exactly equal to 25, i.e. the rich would earn 25 times as much as the poorest half of the population. In other words, the T10/B50 gap is higher than 25 when the share that the top 10% earn is more than 50% of the total and the share of the bottom 50% is less than 10%, and lower than 25 when the opposite happens.
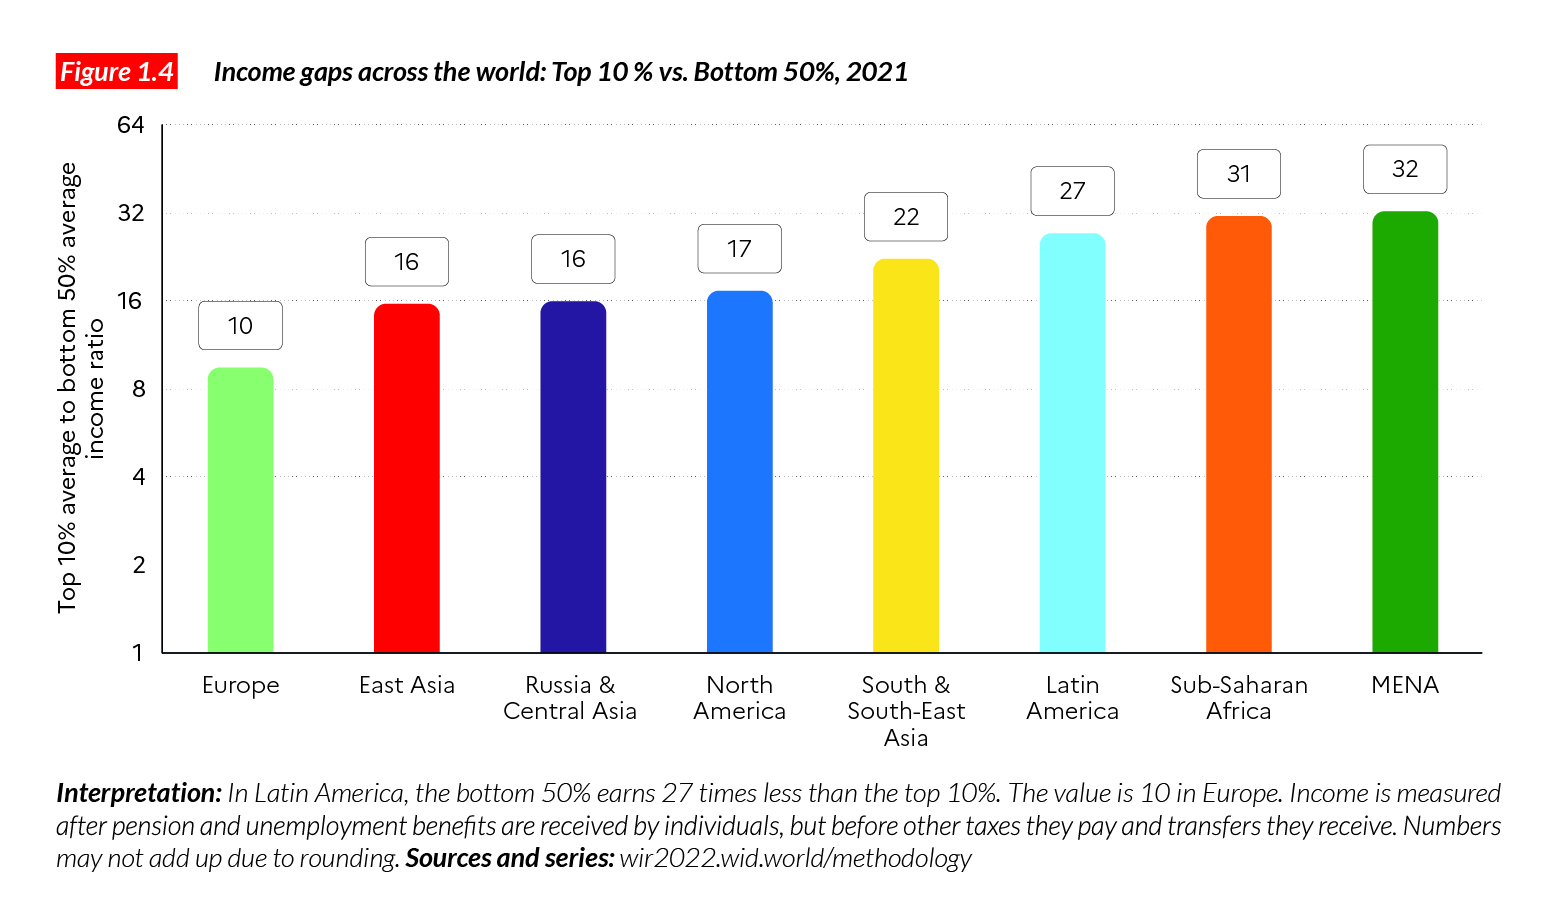
In practice, extremely unequal regions exhibit T10/B50 income gaps higher than 20. In East Asia, Russia and Central Asia, and North America, the top 10% earn 16 times more than the poorest half of the population. In Europe, the income gap is 10 in 2020-2021 (Figure 1.4). As we can see, inequality levels in Europe are nearly half those of in East Asia, Russia and Central Asia, and North America. Inequality levels are also nearly double between these latter regions and those marked by more extreme inequality levels.
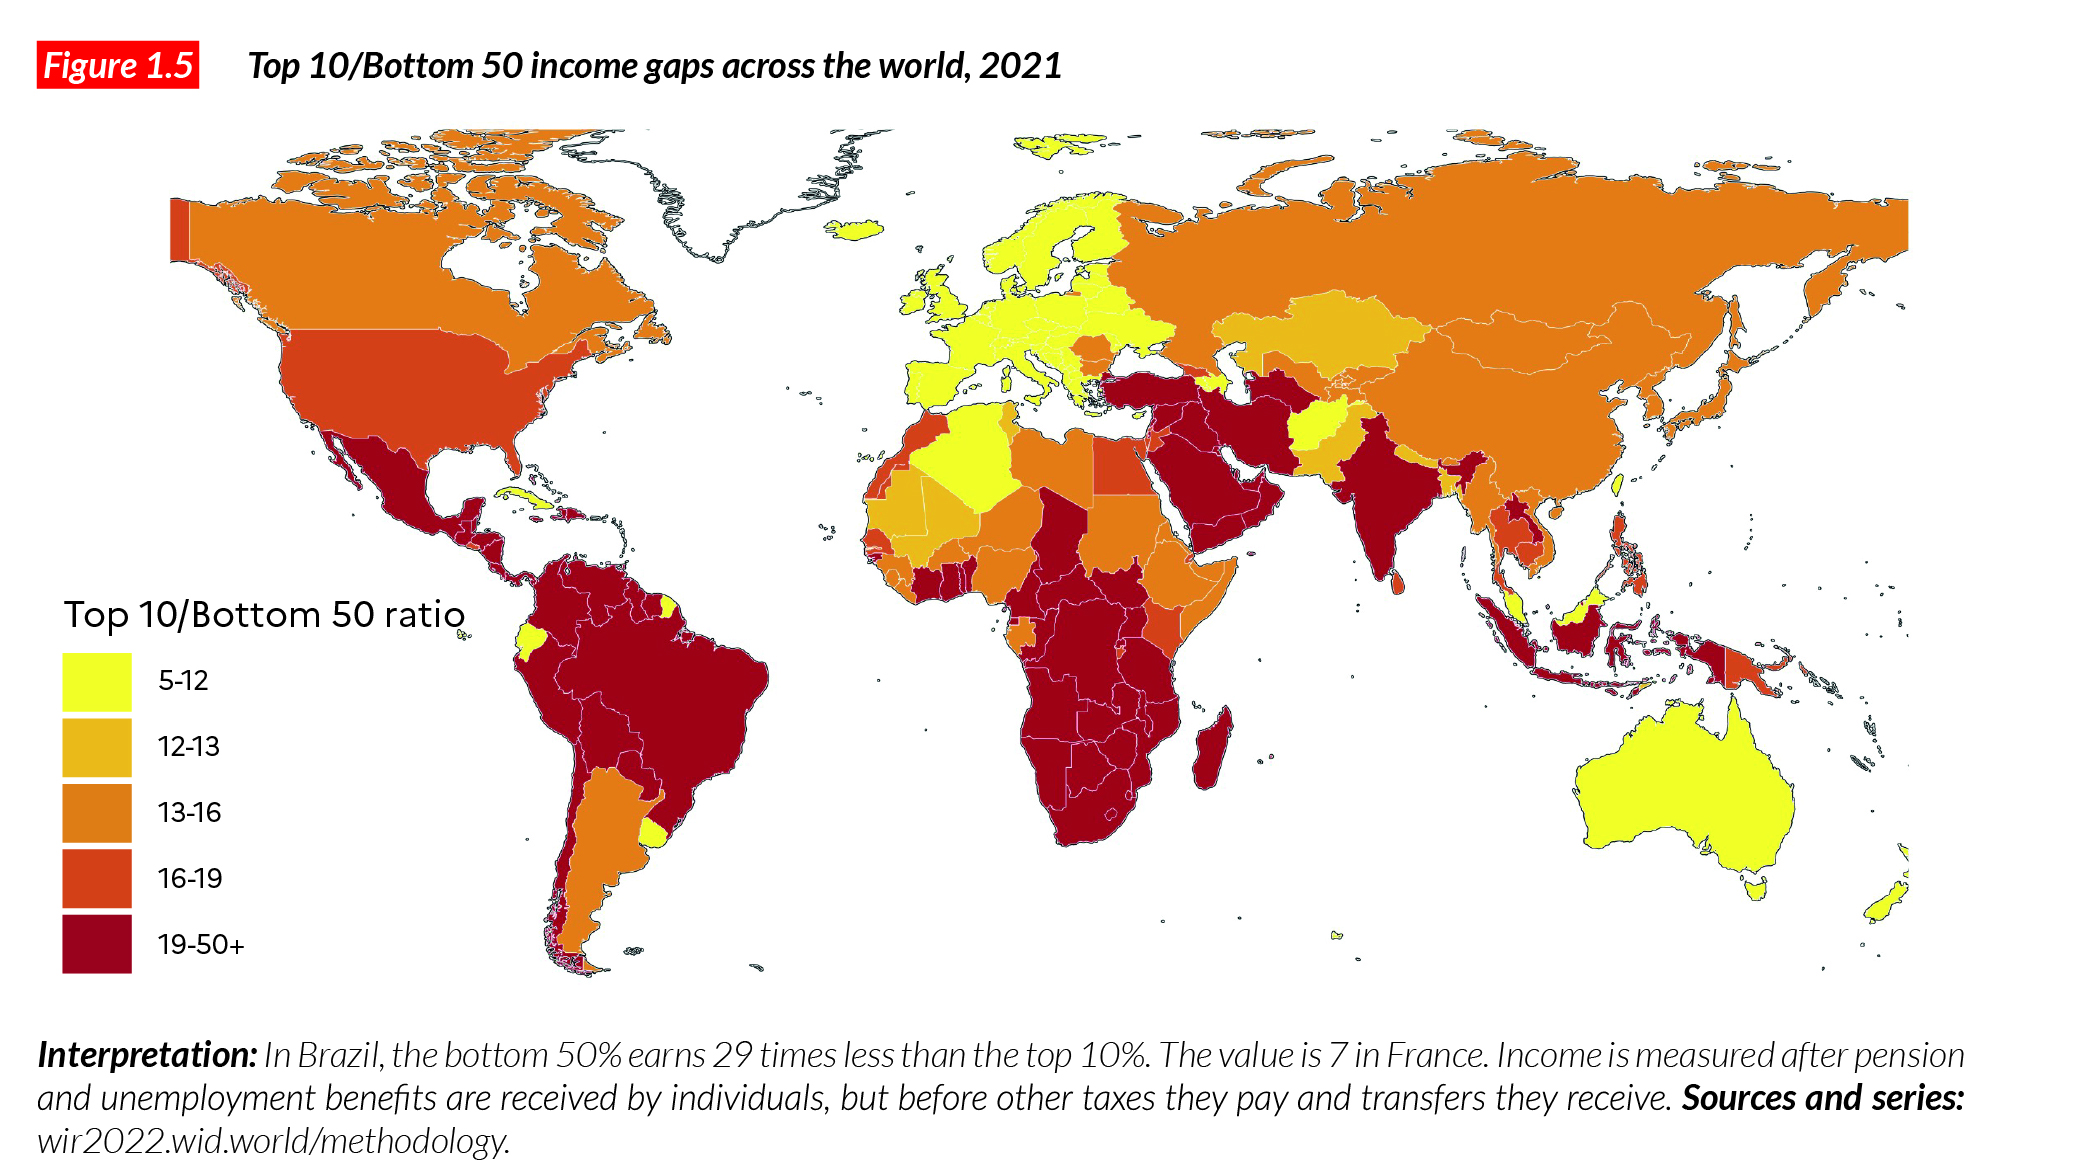
Differences in inequality are not well explained by geographic or average income differences
Regional inequality levels mask significant variations in inequality between countries within regions, further demonstrating that inequality levels are not determined by geography or development levels. Figure 1.5 (see also online tables) presents T10/B50 income gaps for all countries across the world. In Africa, income gaps vary from 13 to 15 in Nigeria, Ethiopia, Guinea and Mali, for instance, to between 40 and 63 in the Central African Republic, Namibia, Zambia and South Africa. In South and Southeast Asia, India’s T10/B50 income gap is 22, significantly above Thailand’s value of 17. In Latin America, Argentina’s income gap is 13 while it is 29 in neighboring Brazil and Chile. Between high-income countries, significant variations are also seen: in Germany, France, Denmark and the UK, the T10/B50 income gap is between seven and 10 while the US income gap is over 17. For any given level of development, there is indeed a large variety of possible inequality levels.
The geographical repartition of global incomes
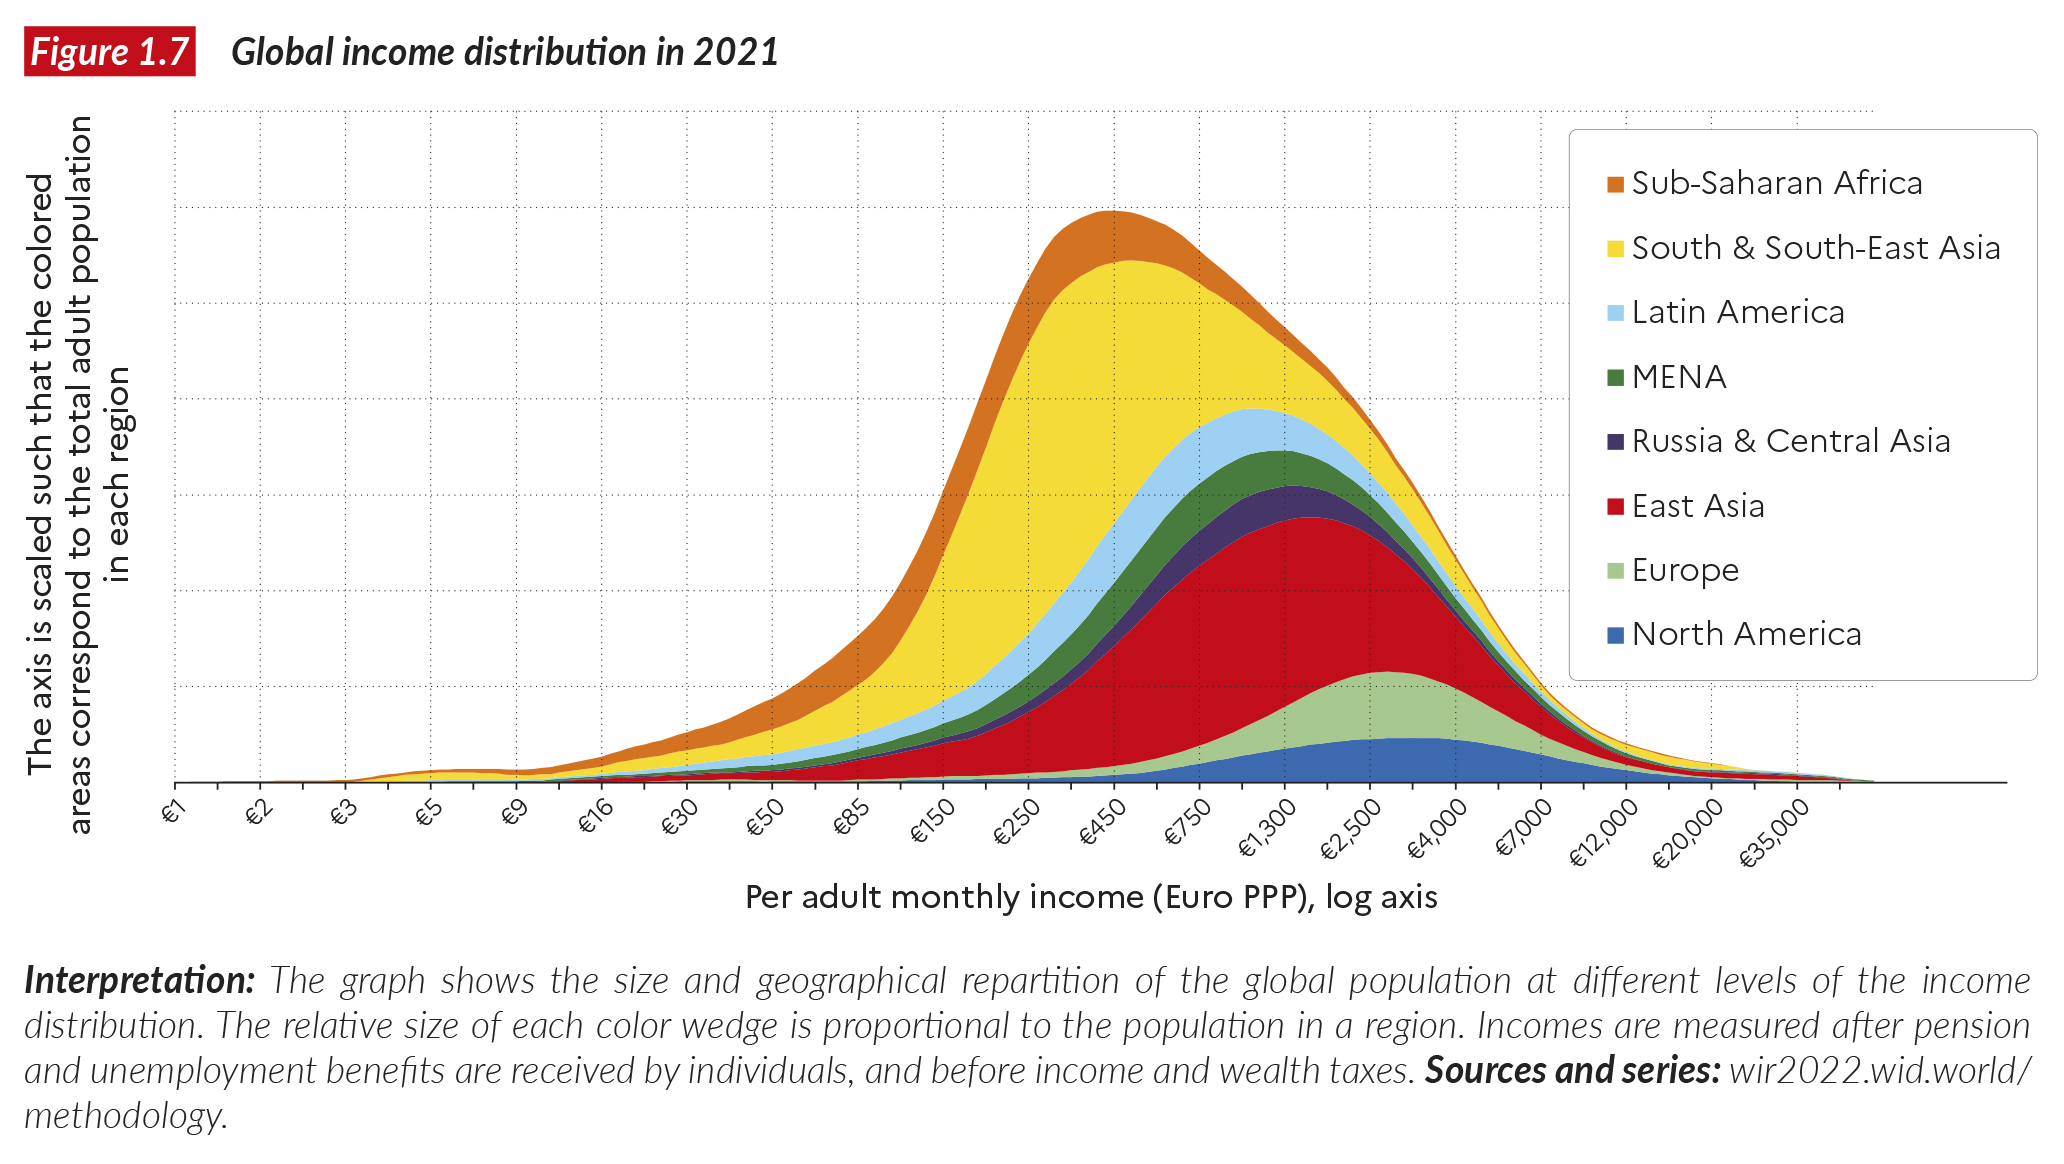
Figure 1.7a presents the relative size of the population of each region at different levels of the global income distribution in 2021. Each colored wedge is proportional to the total adult population of a region. Sub-Saharan Africa and South and South-East Asia occupy the bottom of the distribution, with the bulk of their population between €1,000 and €7,000 per year. The bulk of East Asians, including Chinese, stands between €5,000 and €40,000. North Americans and Europeans are mainly represented between €20,000 and €70,000.
Figure 1.8 provides another type of geographical decomposition of global incomes. The graph presents, for each percentile of the global income distribution, the share of each region. Europe and North America are almost only present between the top 50% of the distribution and more so in the top 30%. The graph also shows that emerging and developing countries can combine both a very large share of extremely poor individuals and a relatively good representation among the world’s top income groups..
The limited impact of redistribution on global inequality
It should be noted that the income figures reported above are measured after operations related to pension and unemployment benefit systems (i.e. after contributions made and transfers received by individuals for their pensions and public unemployment insurance schemes, but before other taxes and transfers that they pay and receive). Taking pensions into account is necessary in order to reduce the influence of aging on inequality (as retirees earn little income through work but receive deferred earnings through pension schemes).
For reasons explained below, it is essential to measure inequality both before and after the operation of taxes and transfers if we are to arrive at a good understanding of how redistribution (through taxes and transfers) affects inequality.
Taxes, and the transfers that they finance, generally reduce inequality because they redistribute income (or wealth). We call such inequality reduction through taxes and transfers redistribution. Taxes include taxes on income (e.g., individual income taxes, and social contributions taken from labor earnings for health insurance), taxes on consumption (such as Value Added or Goods and Service Taxes) and taxes on wealth (e.g., property taxes)9 Transfers include all social transfers received by individuals (except pensions and unemployment insurance, which are included in our definition of income before taxes, in order to make international comparisons more meaningful)10.
Pre-distribution can be defined as the set of policies and institutions that reduce pre-tax income inequality. Pre-distribution policies include minimum wages rules (applied in some countries to prevent earnings from being too low), free/accessible education (which make it possible for children from low- income backgrounds to receive high quality education and have good earnings as adults), rent controls (which regulate the rents that landlords can charge), antitrust laws (which limit the power and profits of monopolies), and the like.11 Significantly, the impact of pre-distribution policies on inequality is less directly visible than the impact of redistribution through taxes and transfers, but the very large variation in pre-tax income inequality across countries at similar stages of economic development shows that pre-distribution is critically important in controlling inequality.
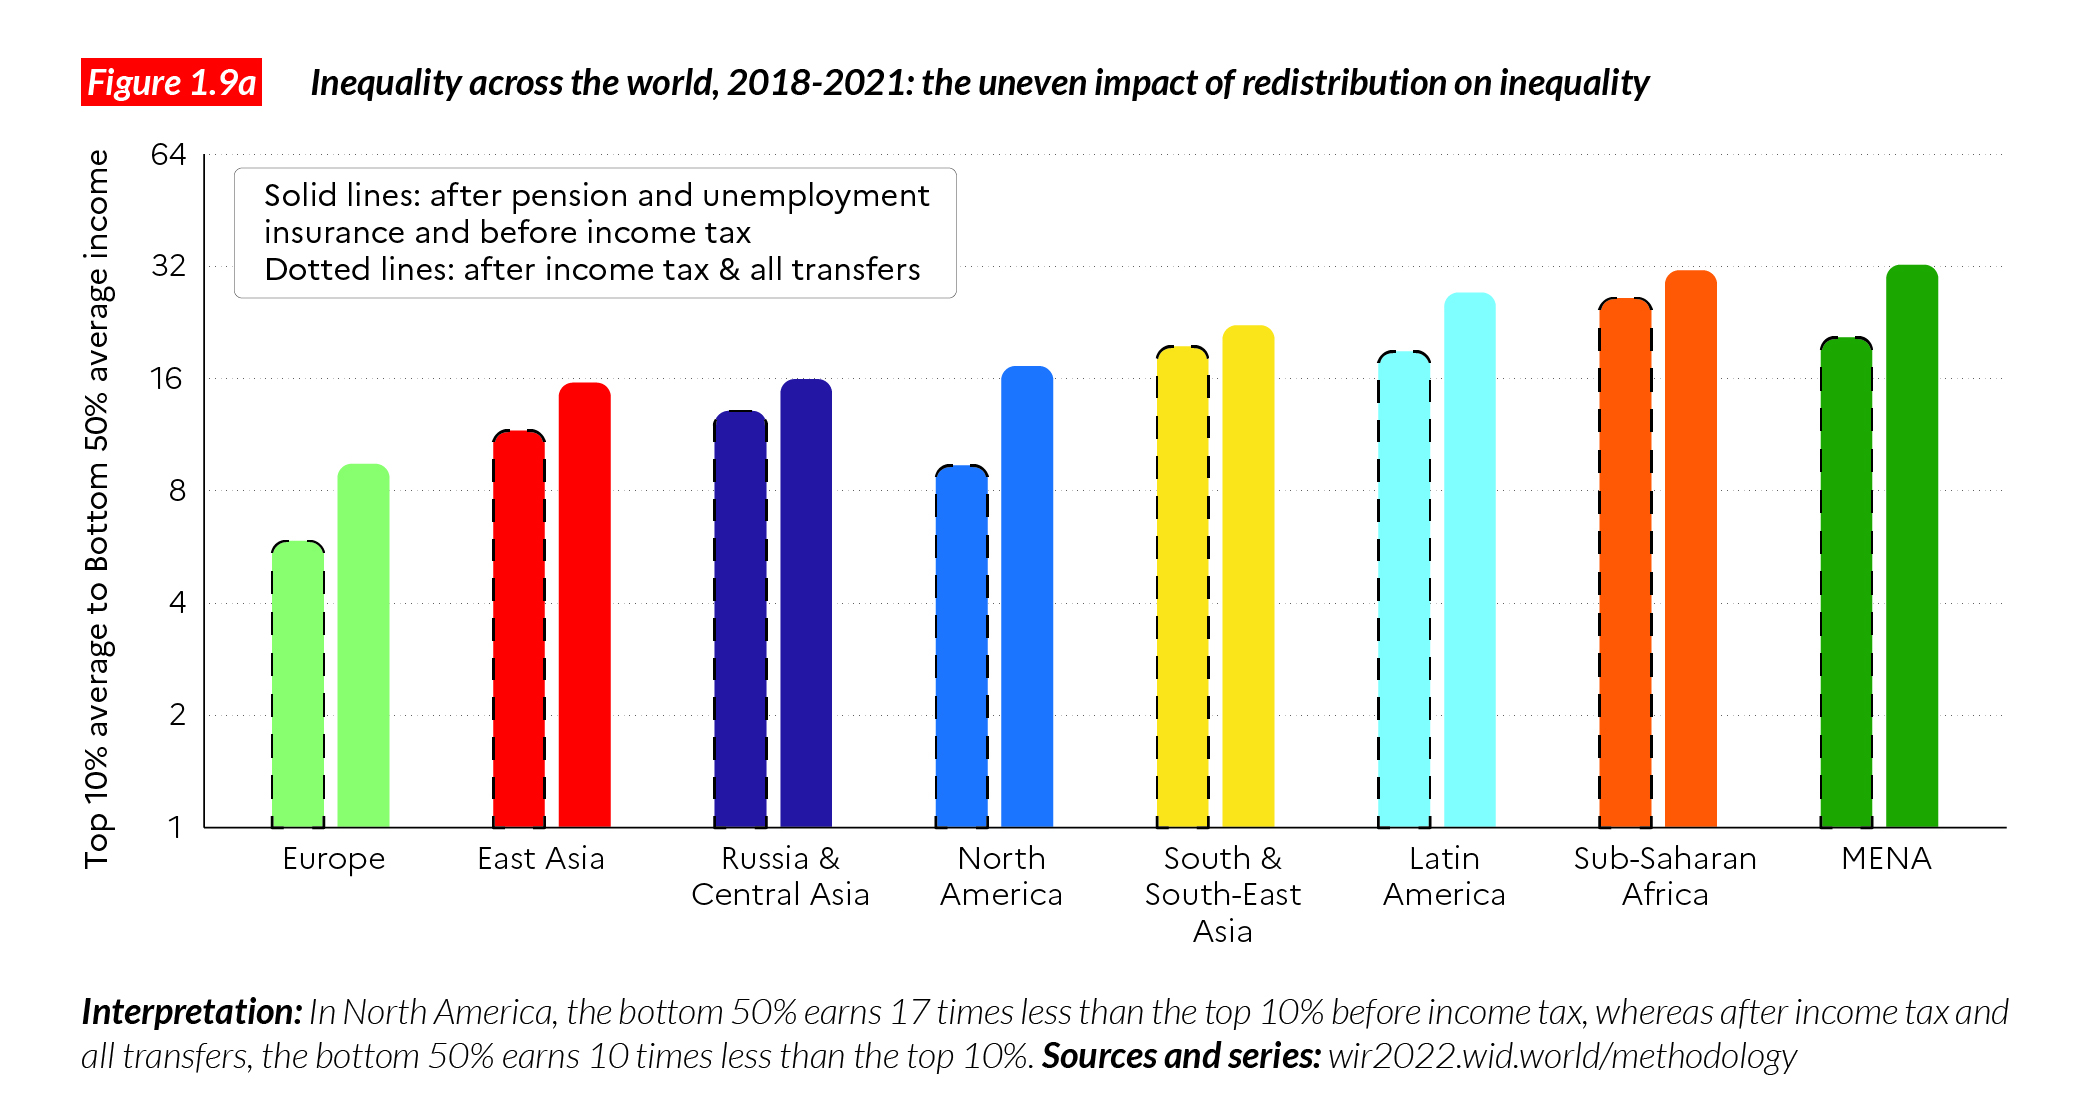
Figure 1.9a shows T10/B50 income gaps across world regions before and after the operation of tax and transfer systems. Solid lines show the level of inequality before redistribution but after the operation of pre-distribution mechanisms, whereas broken lines show the level of inequality after redistribution. Three results stand out. First, inequality after redistribution is lower than inequality before taxes in all regions of the world: taxes and transfers reduce inequality everywhere. While this may seem self-evident to readers today, historically this was not always so. In pre-modern or ternary societies, taxes were paid by the working classes to finance the standards of living of the political and religious elite as well as expensive wars12. In the 19th and early 20th century, progressive tax systems started to appear in European countries but, at the same time, European colonial powers implemented regressive tax and transfer systems in colonial societies13 The development of a progressive tax system was one of the clear social improvements of the 20th century but this system is by no means irreversible. In several countries, tax systems have become regressive over the past four decades, meaning that the rich pay less tax, as a share of their income, than the middle or working classes (more on this in Chapters 7, 8 and 9).
Second, even if taxes and transfers reduce inequality across the world, their impact seems relatively modest. In regions that are extremely unequal before taxes and transfers, inequality remains extremely high after taxes and transfers. Latin America and Sub-Saharan Africa for instance, with T10/B50 income gaps, move from 25-32 before to 18-26 after the operation of the redistribution system. In East Asia, North America and Central Asia, T10/ B50 income gaps reduce from 15-17 before taxes to 9-11 after taxes. Redistribution in these regions does not lower their inequality levels to close to the values observed in Europe (where the T10/B50 income gap decrease from around nine to six). We can therefore conclude that the biggest share of the inequality gap that exists between relatively equal regions (such as Europe) and relatively unequal regions is explained by pre- distribution, rather than by redistribution per se. In other words, inequality before taxes is a relatively good determinant of inequality after taxes and transfers. Redistribution is important in explaining inequality levels across regions, but pre-distribution matters even more. Third redistribution is quite high in high-income regions (Europe, North America) and almost non-existent in low-income regions (South and Southeast Asia and Sub-Saharan Africa). Poor countries lack the fiscal capacity to reduce inequality. This has implications for current debates about state building and trade liberalization, as well as for the discussion about North–South revenue sharing in relation to the taxing of profits of multinational companies, which we discuss in the final chapter of this report.
The complementarity between predistribution and redistribution
Another way to look at redistribution across the world’s regions is to plot the degree of inequality before taxes on the horizontal axis, and the degree of inequality reduction on the vertical axis. We do this in Figure 1.9b. The lower the inequality before taxes, the higher the level of redistribution. In regions where market inequality levels are relatively low (i.e. where pre-distribution is relatively high), there tend to be more social forces pushing for higher redistribution as well. Conversely, when the institutional and policy set-up does little to reduce inequality in the first place, there are fewer mechanisms to reduce inequality after taxes as well. An important conclusion from this global observation is that high levels of redistribution are difficult to attain with low levels of pre-distribution. These two forms of inequality reduction go hand in hand. In economics speak, they are complements rather than substitutes.
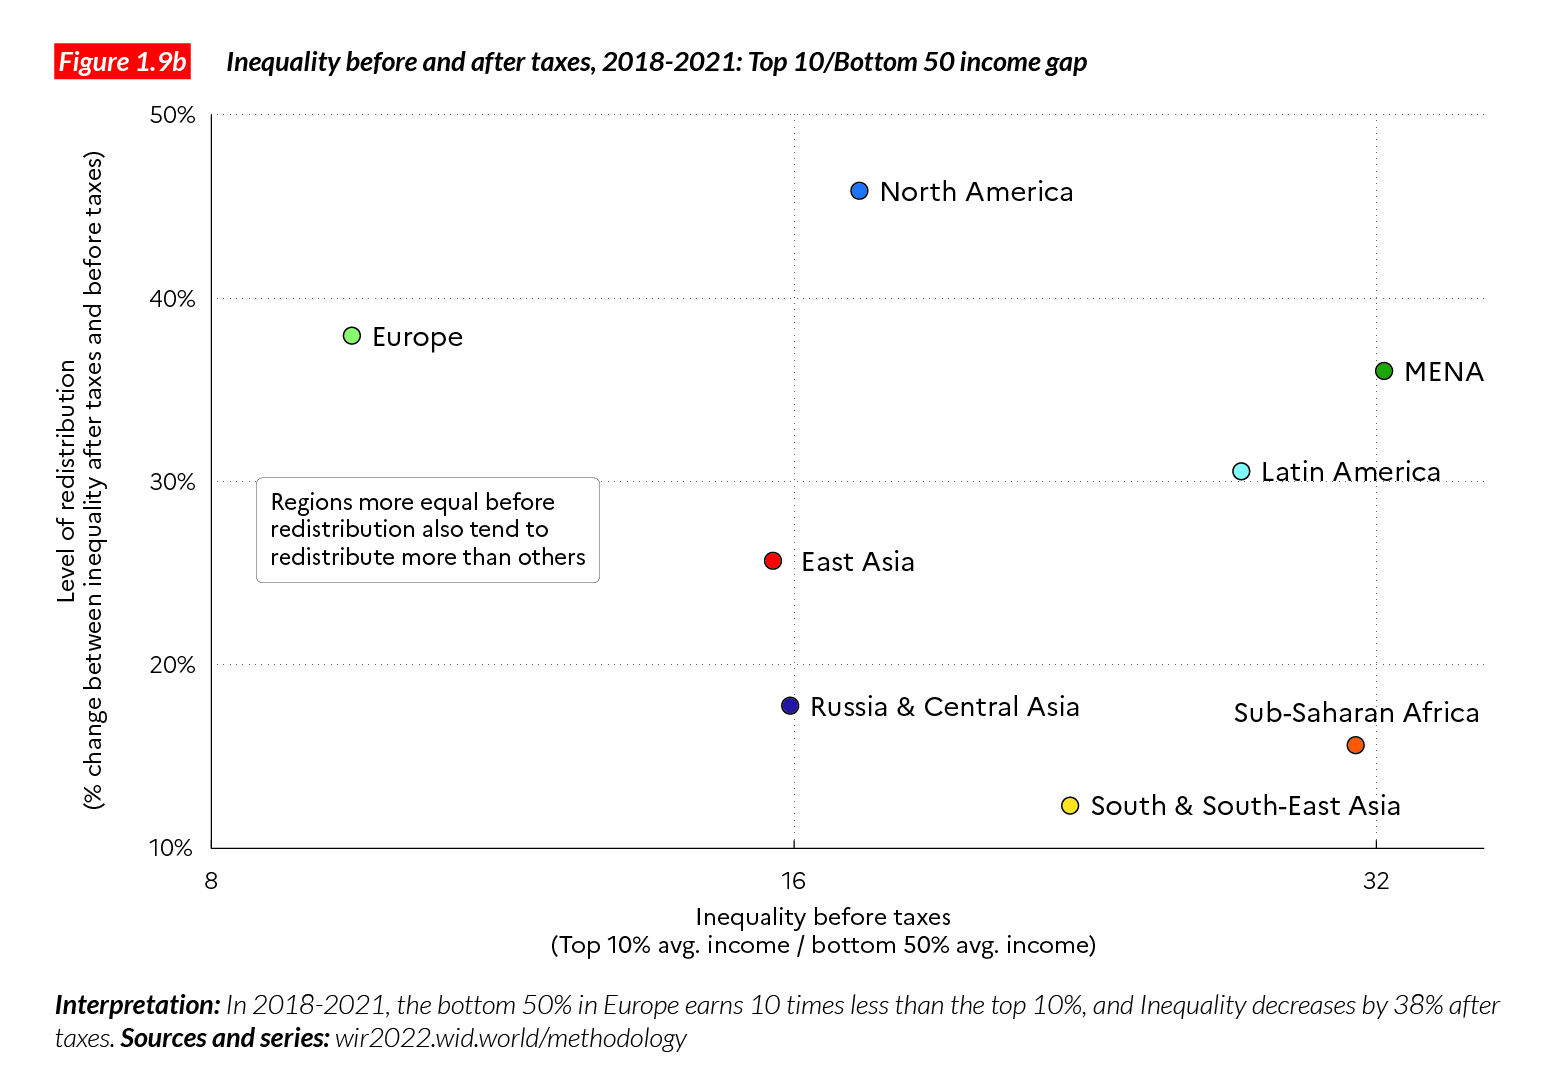
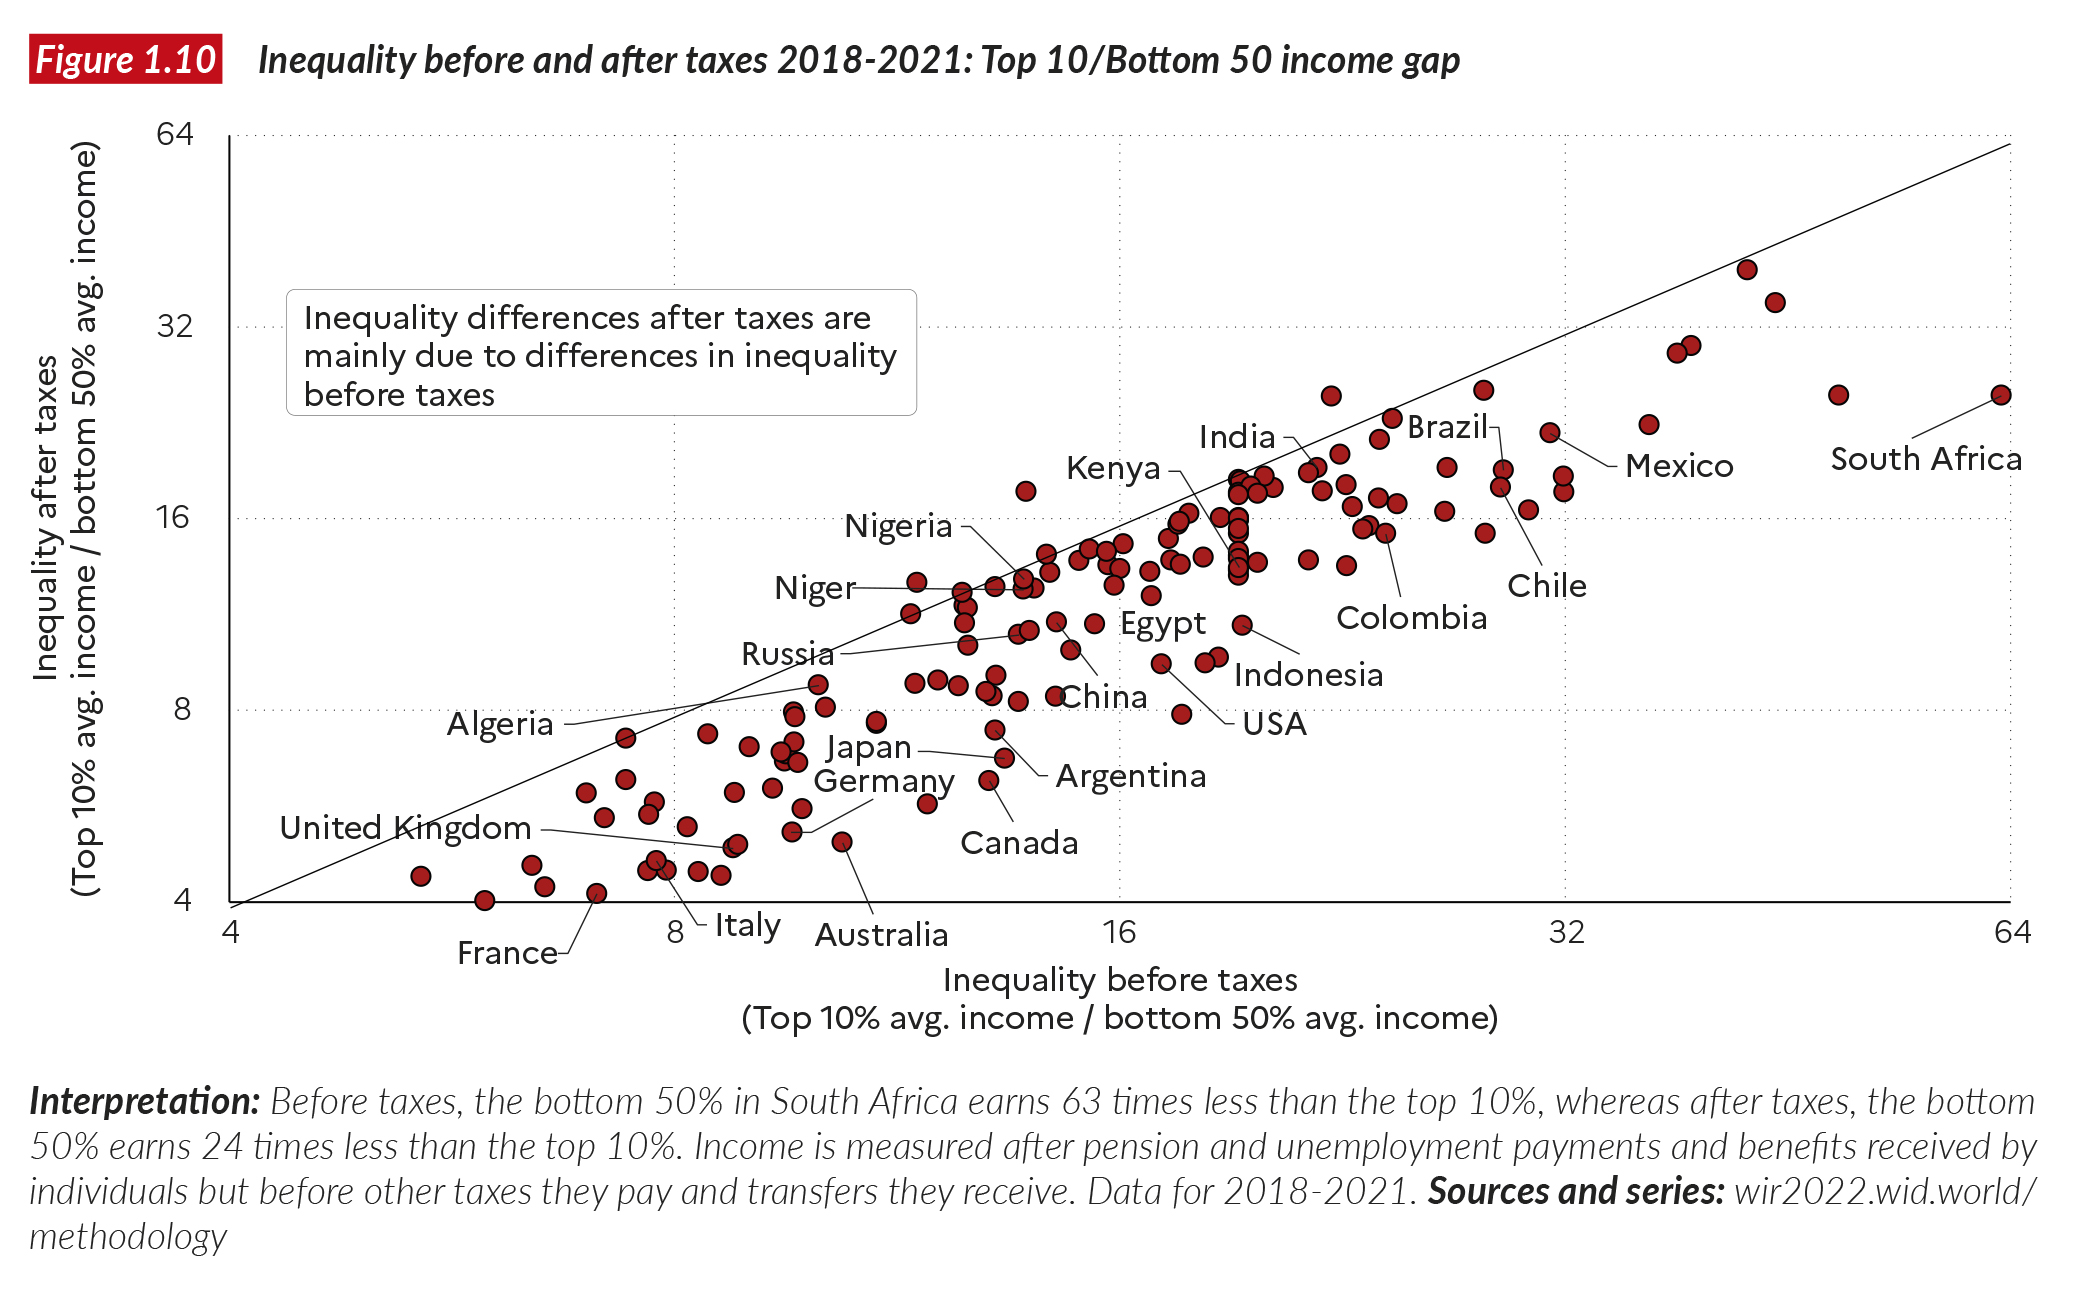
Figure 1.10 shows the relationship between inequality before taxes and transfers (as measured by our T10/B50 income gap, on the horizontal axis) and inequality after taxes transfers (on the vertical axis) across countries. The main observations made at the regional level are confirmed by this more detailed country level representation. Inequality differences after taxes and transfers are mainly driven by inequality differences before taxes and transfers. Pretax inequality explains most of the variations in post-tax inequality levels observed across countries. In other words, redistribution matters to reduce inequality but does not significantly change country rankings. This has important implications for contemporary debates about taxation and social policies, which we return to later in this report.
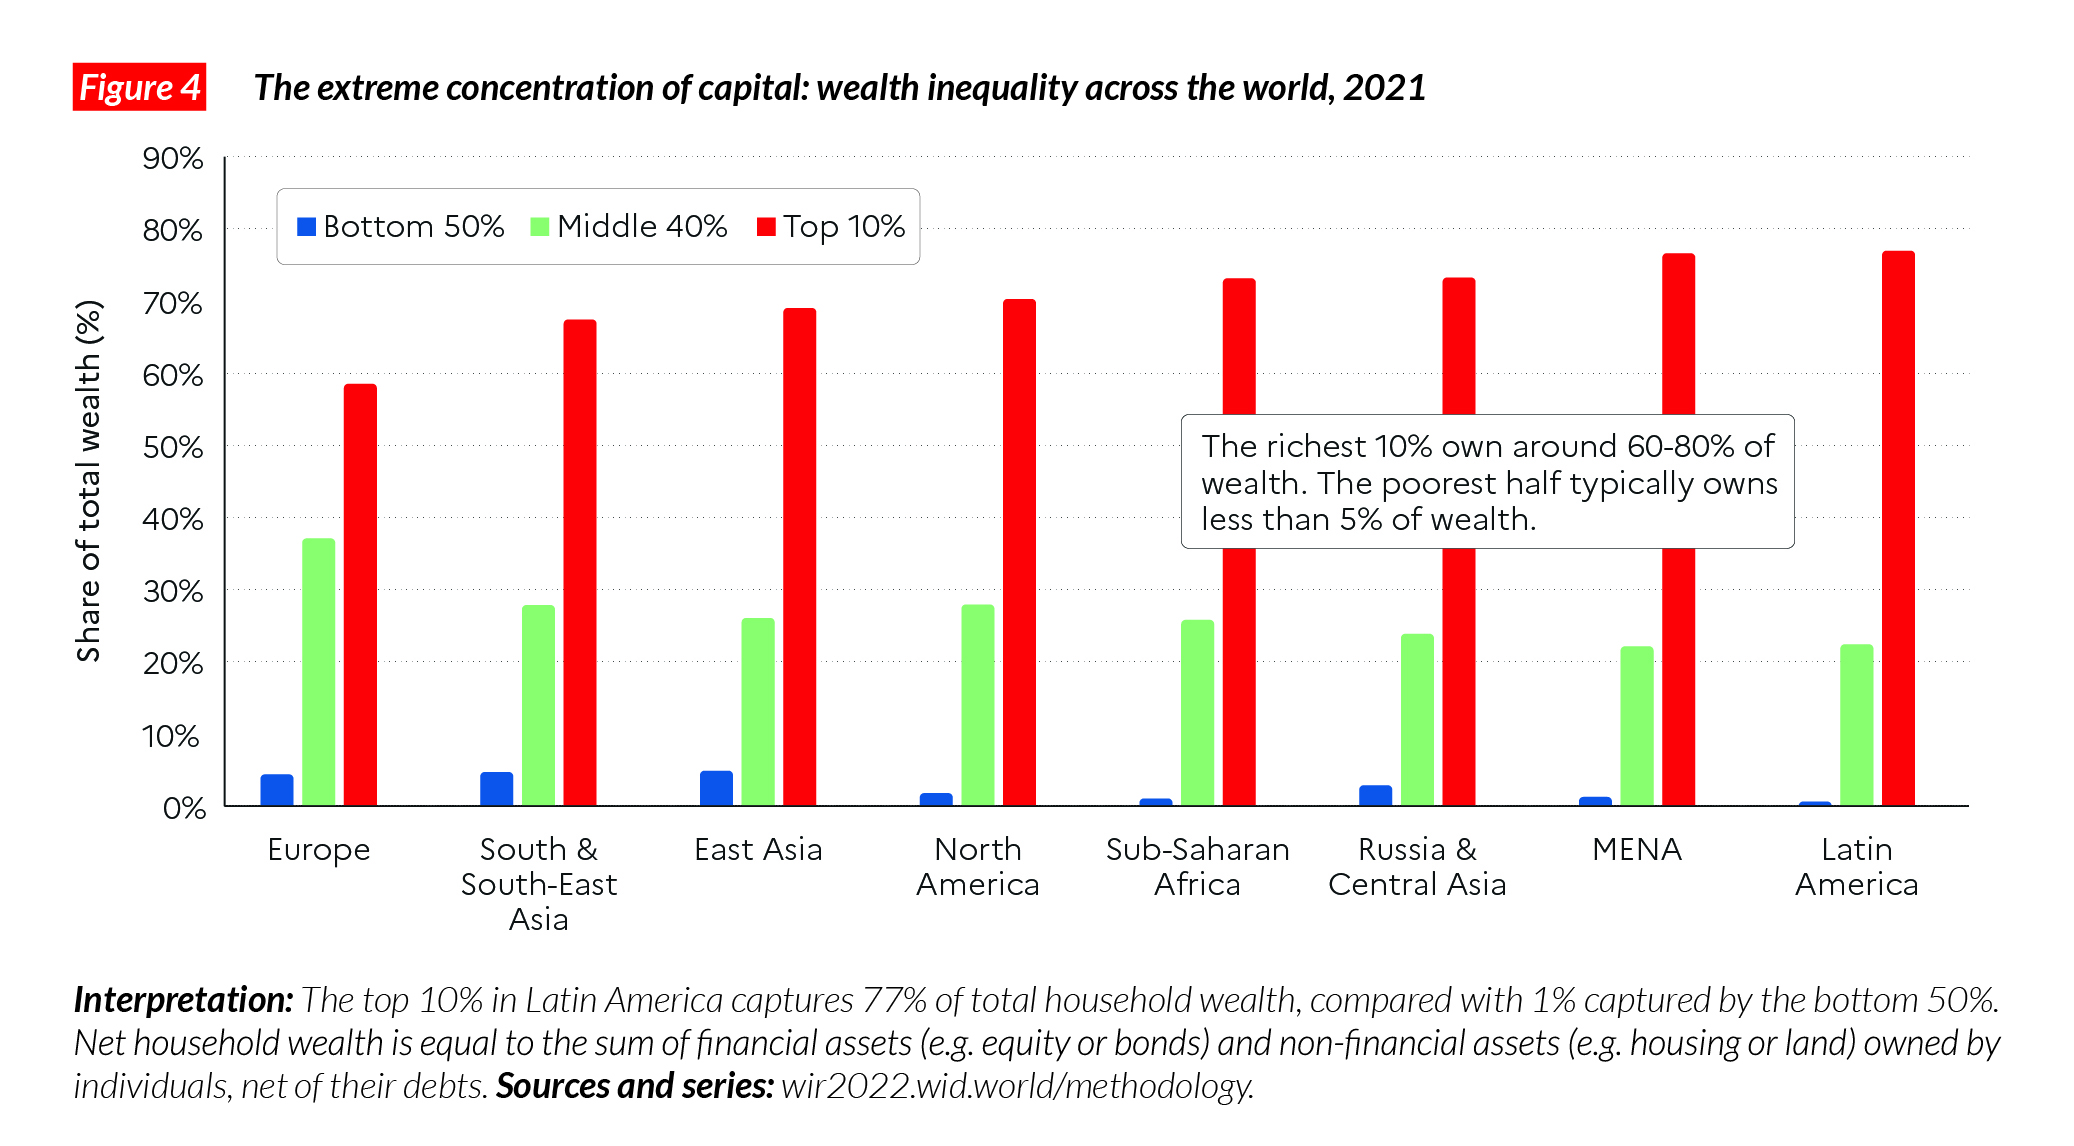
The extreme concentration of capital
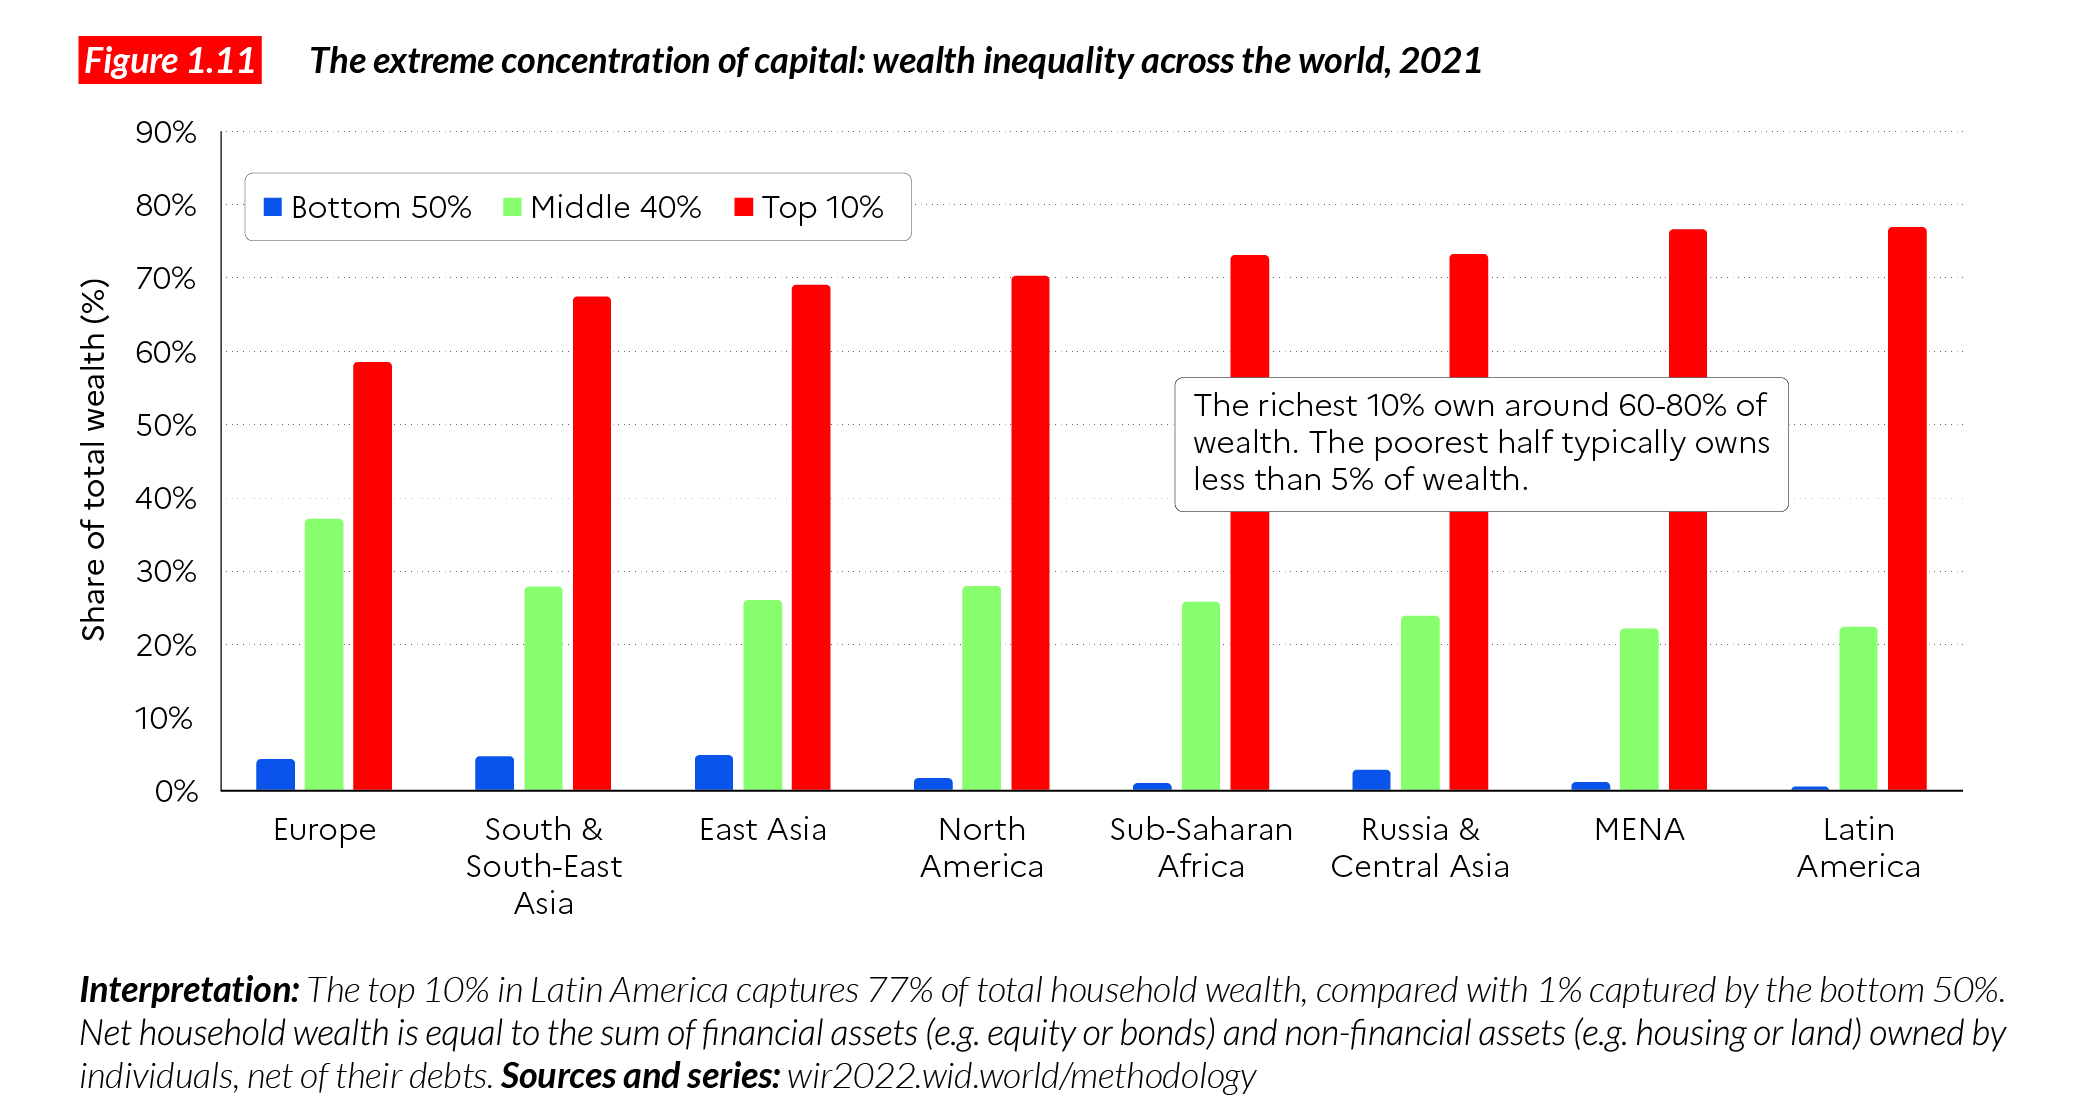
We now turn to regional and national level wealth inequality. Figure 1.11 presents the top 10%, middle 40% and bottom 50% wealth shares for the major regions. It is striking that top 10% wealth shares fall broadly in the 60-80% range in all regions. This reveals the persistence of extremely hierarchical private property systems on all continents, irrespective of the political institutions the societies have opted for and irrespective of their level of economic development. North America, the world’s richest region, is also one of the most unequal when it comes to wealth ownership.
Yet, there are notable differences between the regions. In particular, the middle 40% wealth group owns 20-30% in all regions except in Europe, where its share is close to 40%. This means that, in Europe, the patrimonial middle class owns close to the average wealth of this region. This European middle class emerged in the 20th century and has persisted since. In Chapter 3, we show that the wealth of the middle class in the US has considerably eroded since the 1980s with the rise of the top 1% wealth holders that has captured a disproportionate share of capital accumulated since then.Looking at the bottom 50% of wealth holders, it is striking that this group holds close to no wealth at all in all regions. Its share in total wealth varies from 1% in Latin America to 4-5% in Europe, East and Central Asia. The bottom half of the population, in all societies of the world, is almost entirely deprived of capital. Even in advanced economies, whatever modest wealth they own (such as housing or retirement funds) is almost entirely offset by debt. Moreover, this situation is particularly worrying for future income inequality levels because inequality in asset ownership has direct consequences on income inequality through capital income, and indirect consequences through unequal inheritances.
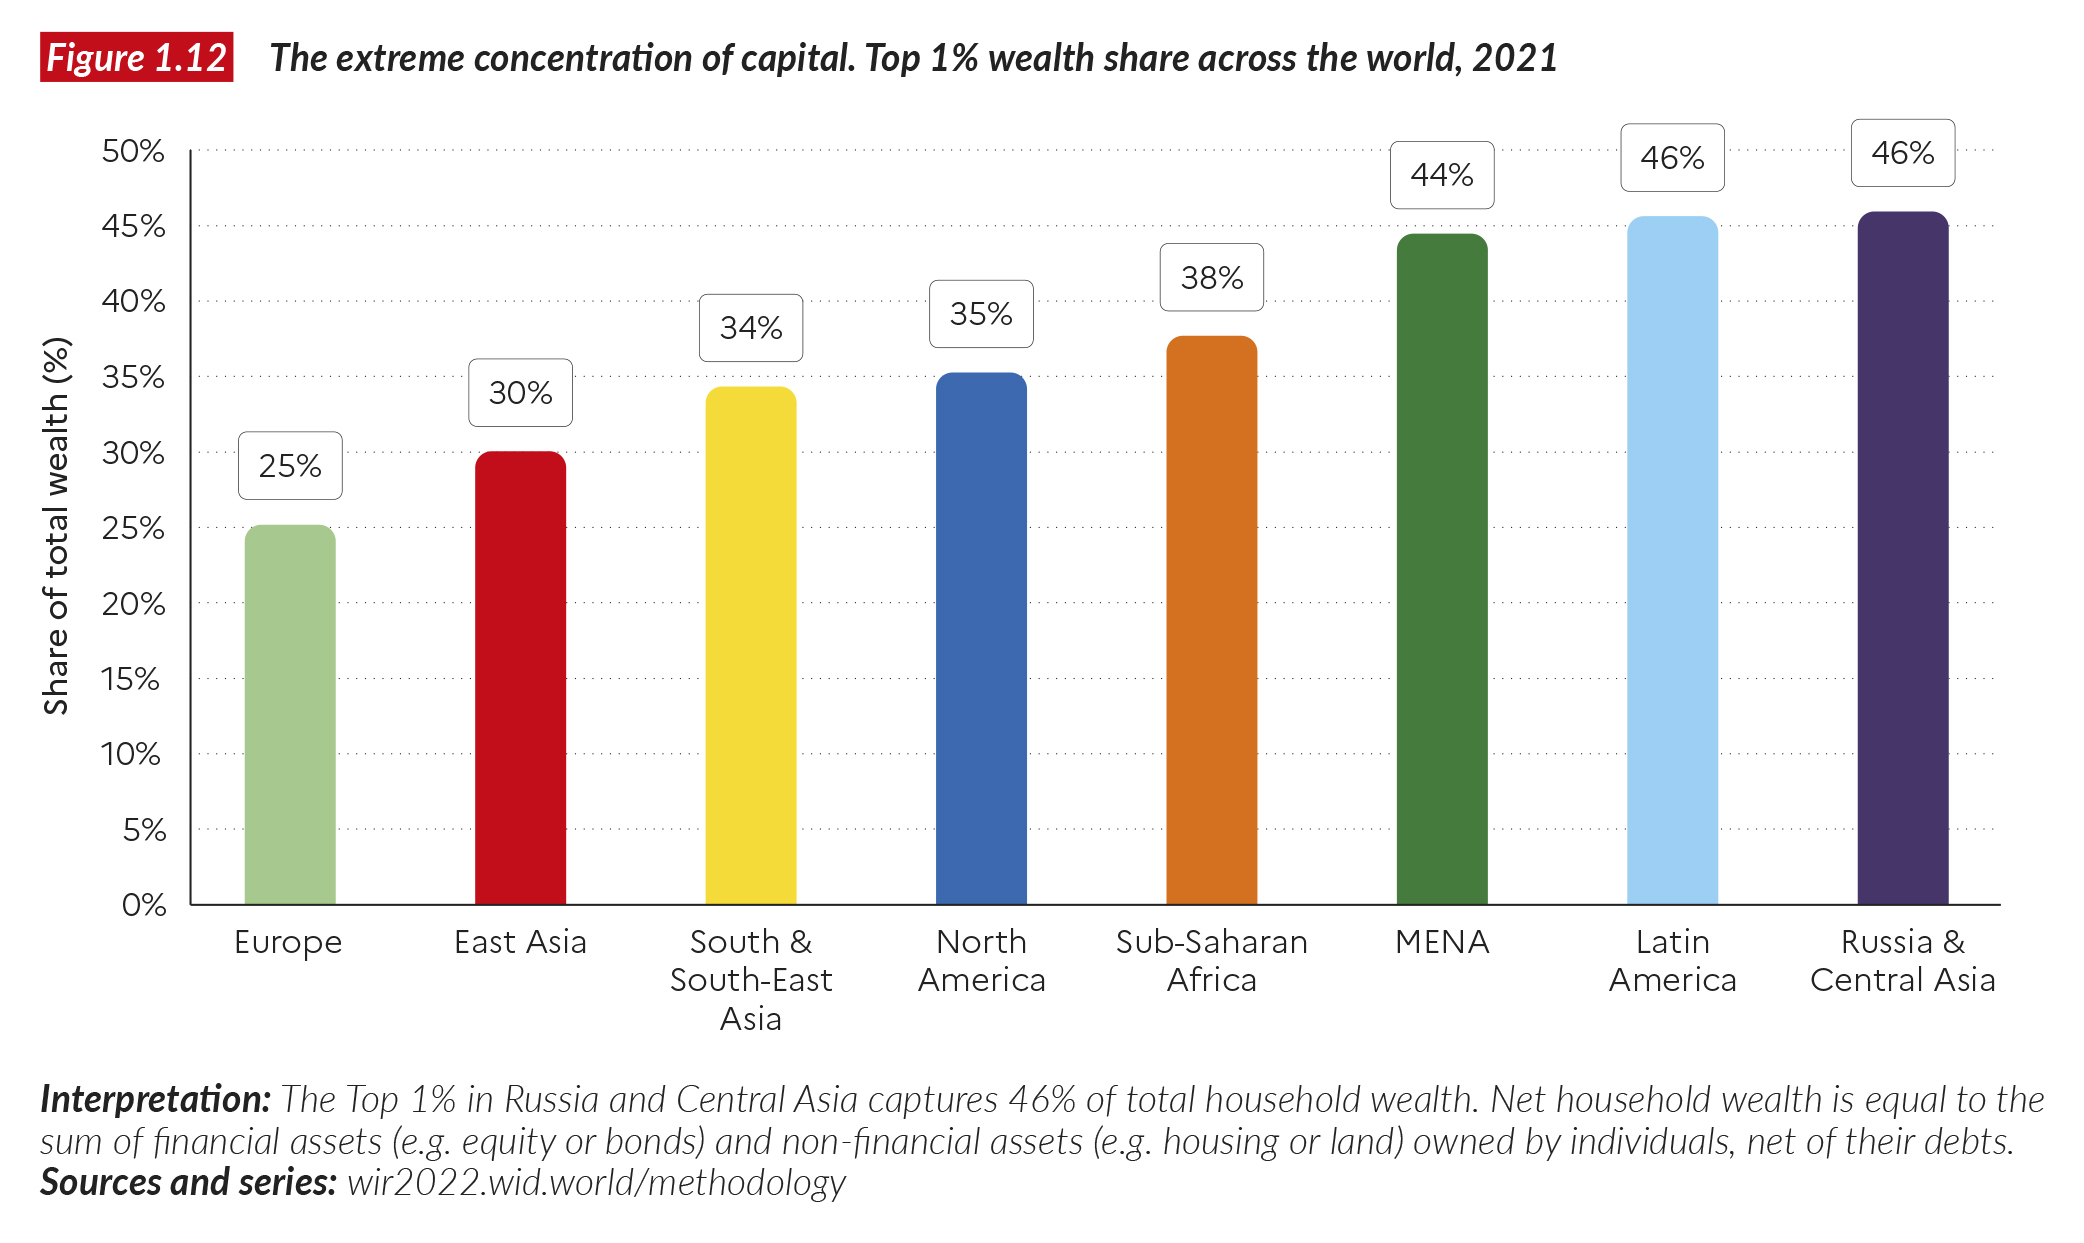
To get a better sense of the extreme wealth inequalities observed across the world, it is also useful to zoom in on the top 10% of wealth holders. Figure 1.12 presents the top 1% wealth shares across world regions. The richest 1% own between one quarter in Europe and 35-46% in North and Latin America of total wealth.
In order to compare the magnitude of wealth inequality with that of income inequality,
Figure 1.13 presents T10/B50 wealth gaps, i.e. the average wealth of the top 10% divided by the average wealth of the bottom 50% – similar to the indicator used for income. The wealth gaps thus obtained are particularly extreme, with the richest 10% owning around 65 times more wealth than the poorest half of the population in the less unequal regions of the world, and over 100 times more in the most unequal regions of the world. Note that, by definition, such wealth gaps become very great as bottom 50% income shares approach zero, which, unfortunately, is the state of wealth inequality almost everywhere.
Figures 1.14abc present the top 10%, middle 40% and bottom 50% wealth shares across countries. As for income inequality, there are significant variations in wealth inequality within regions and between groups of countries with similar average wealth levels.
The wealth share of the top 10% in the US is higher than 70%, a level closer to that of many extremely unequal Latin American or Sub-Saharan African countries than to European countries.
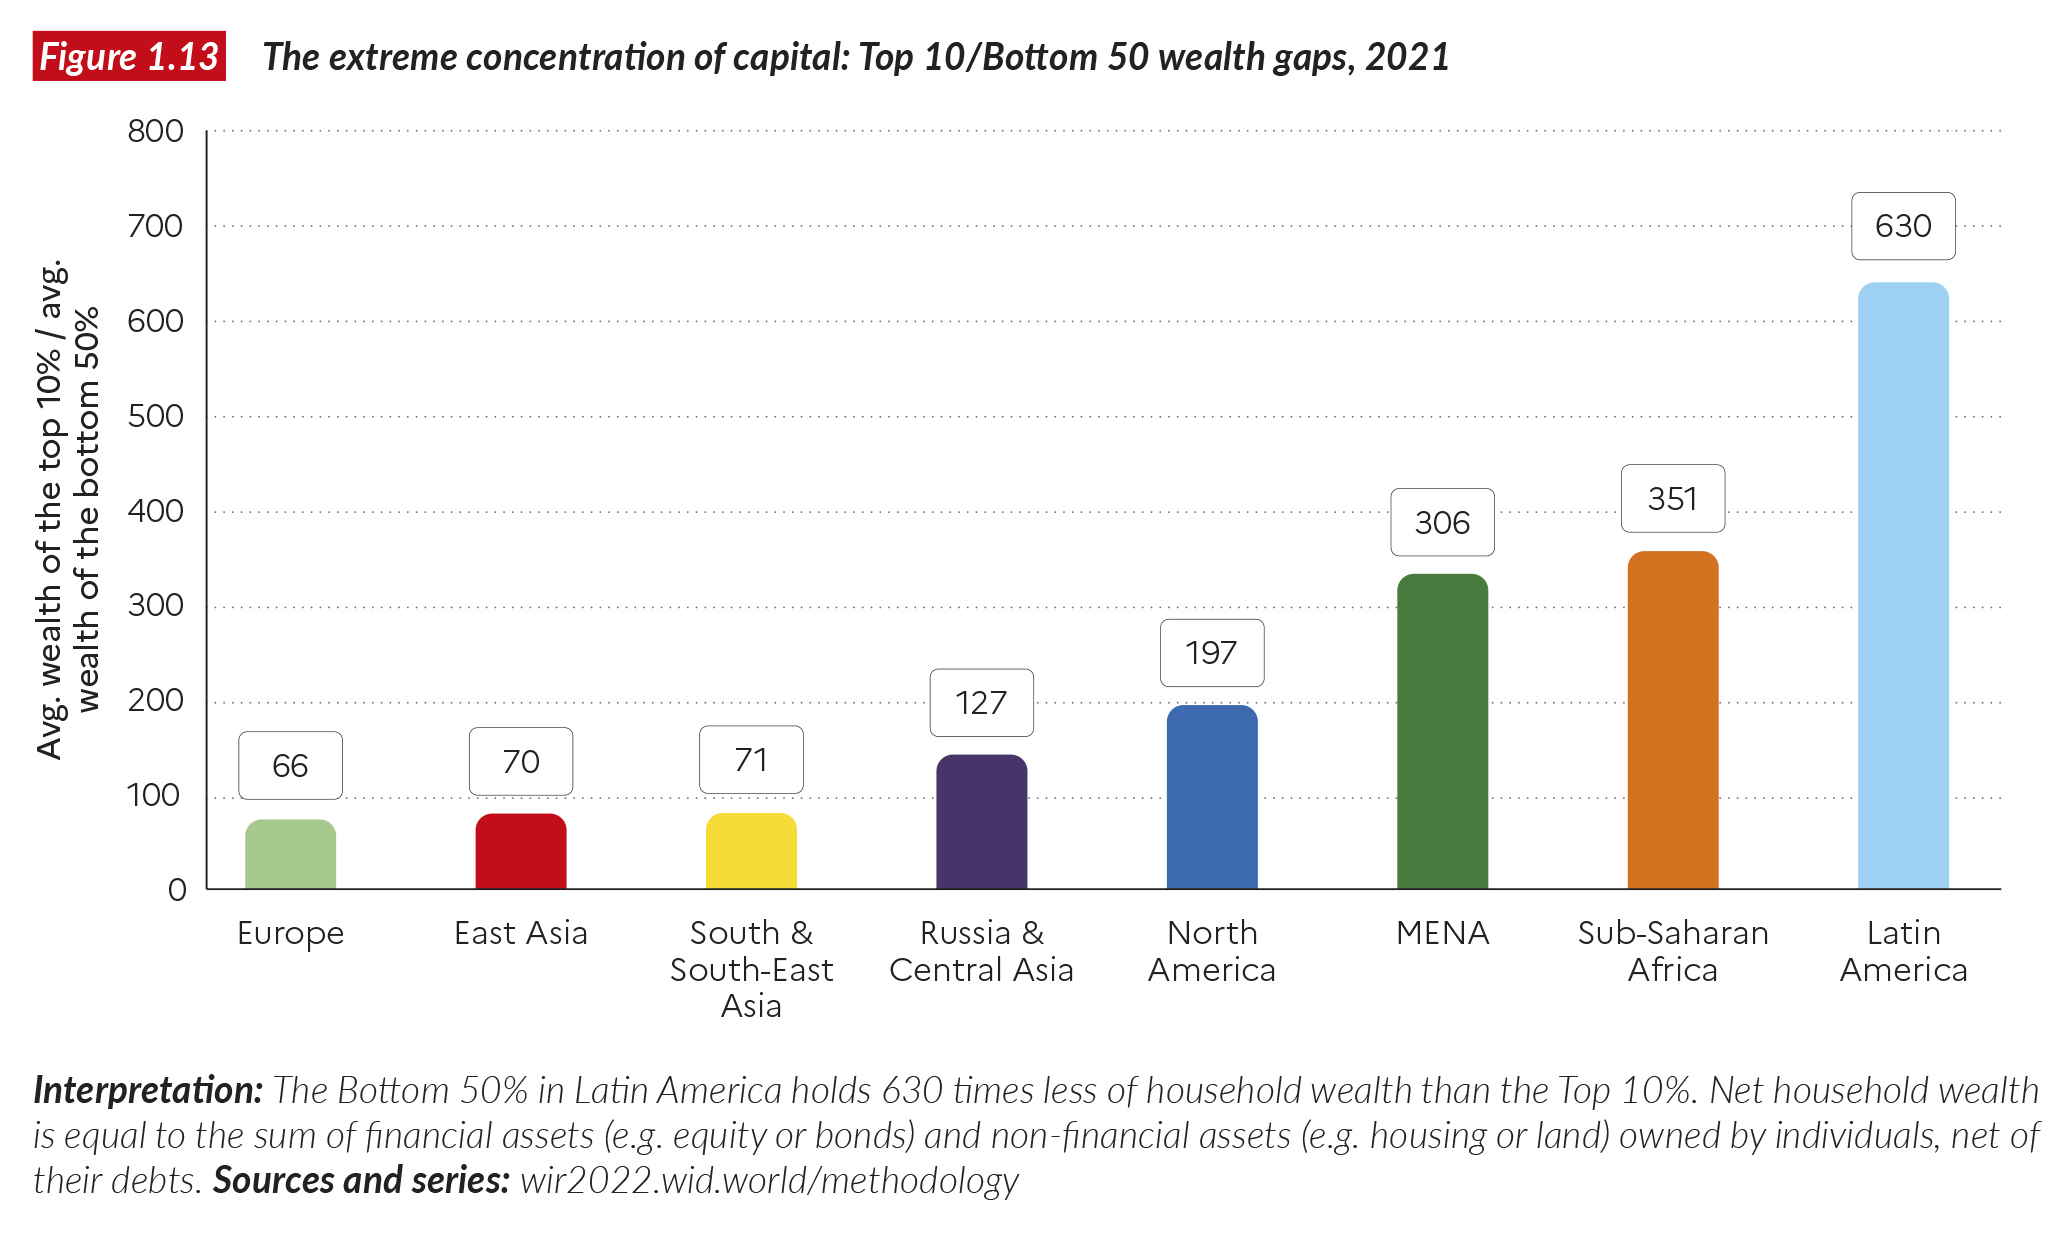
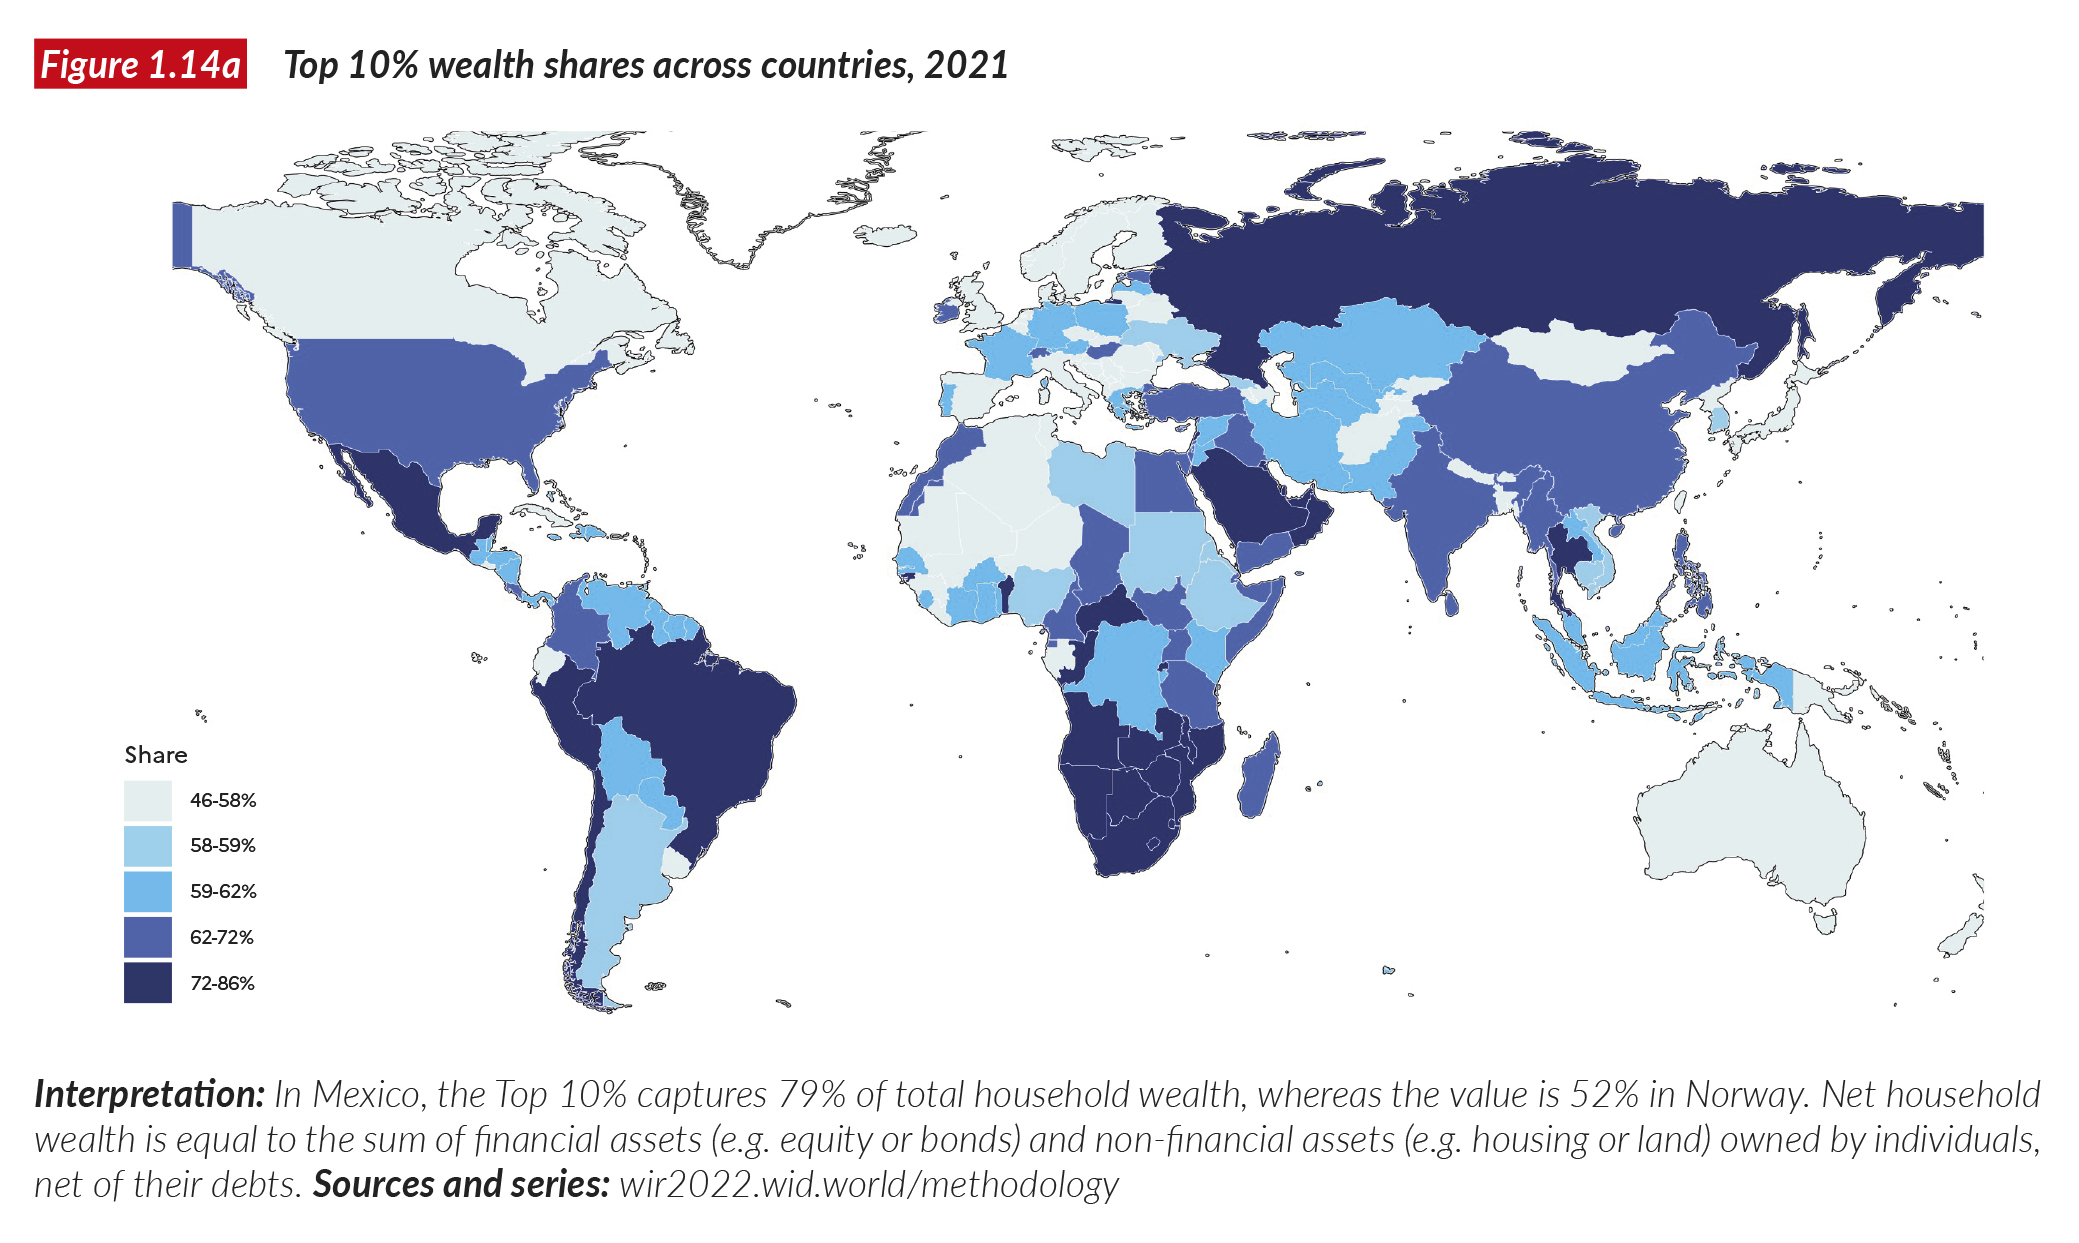
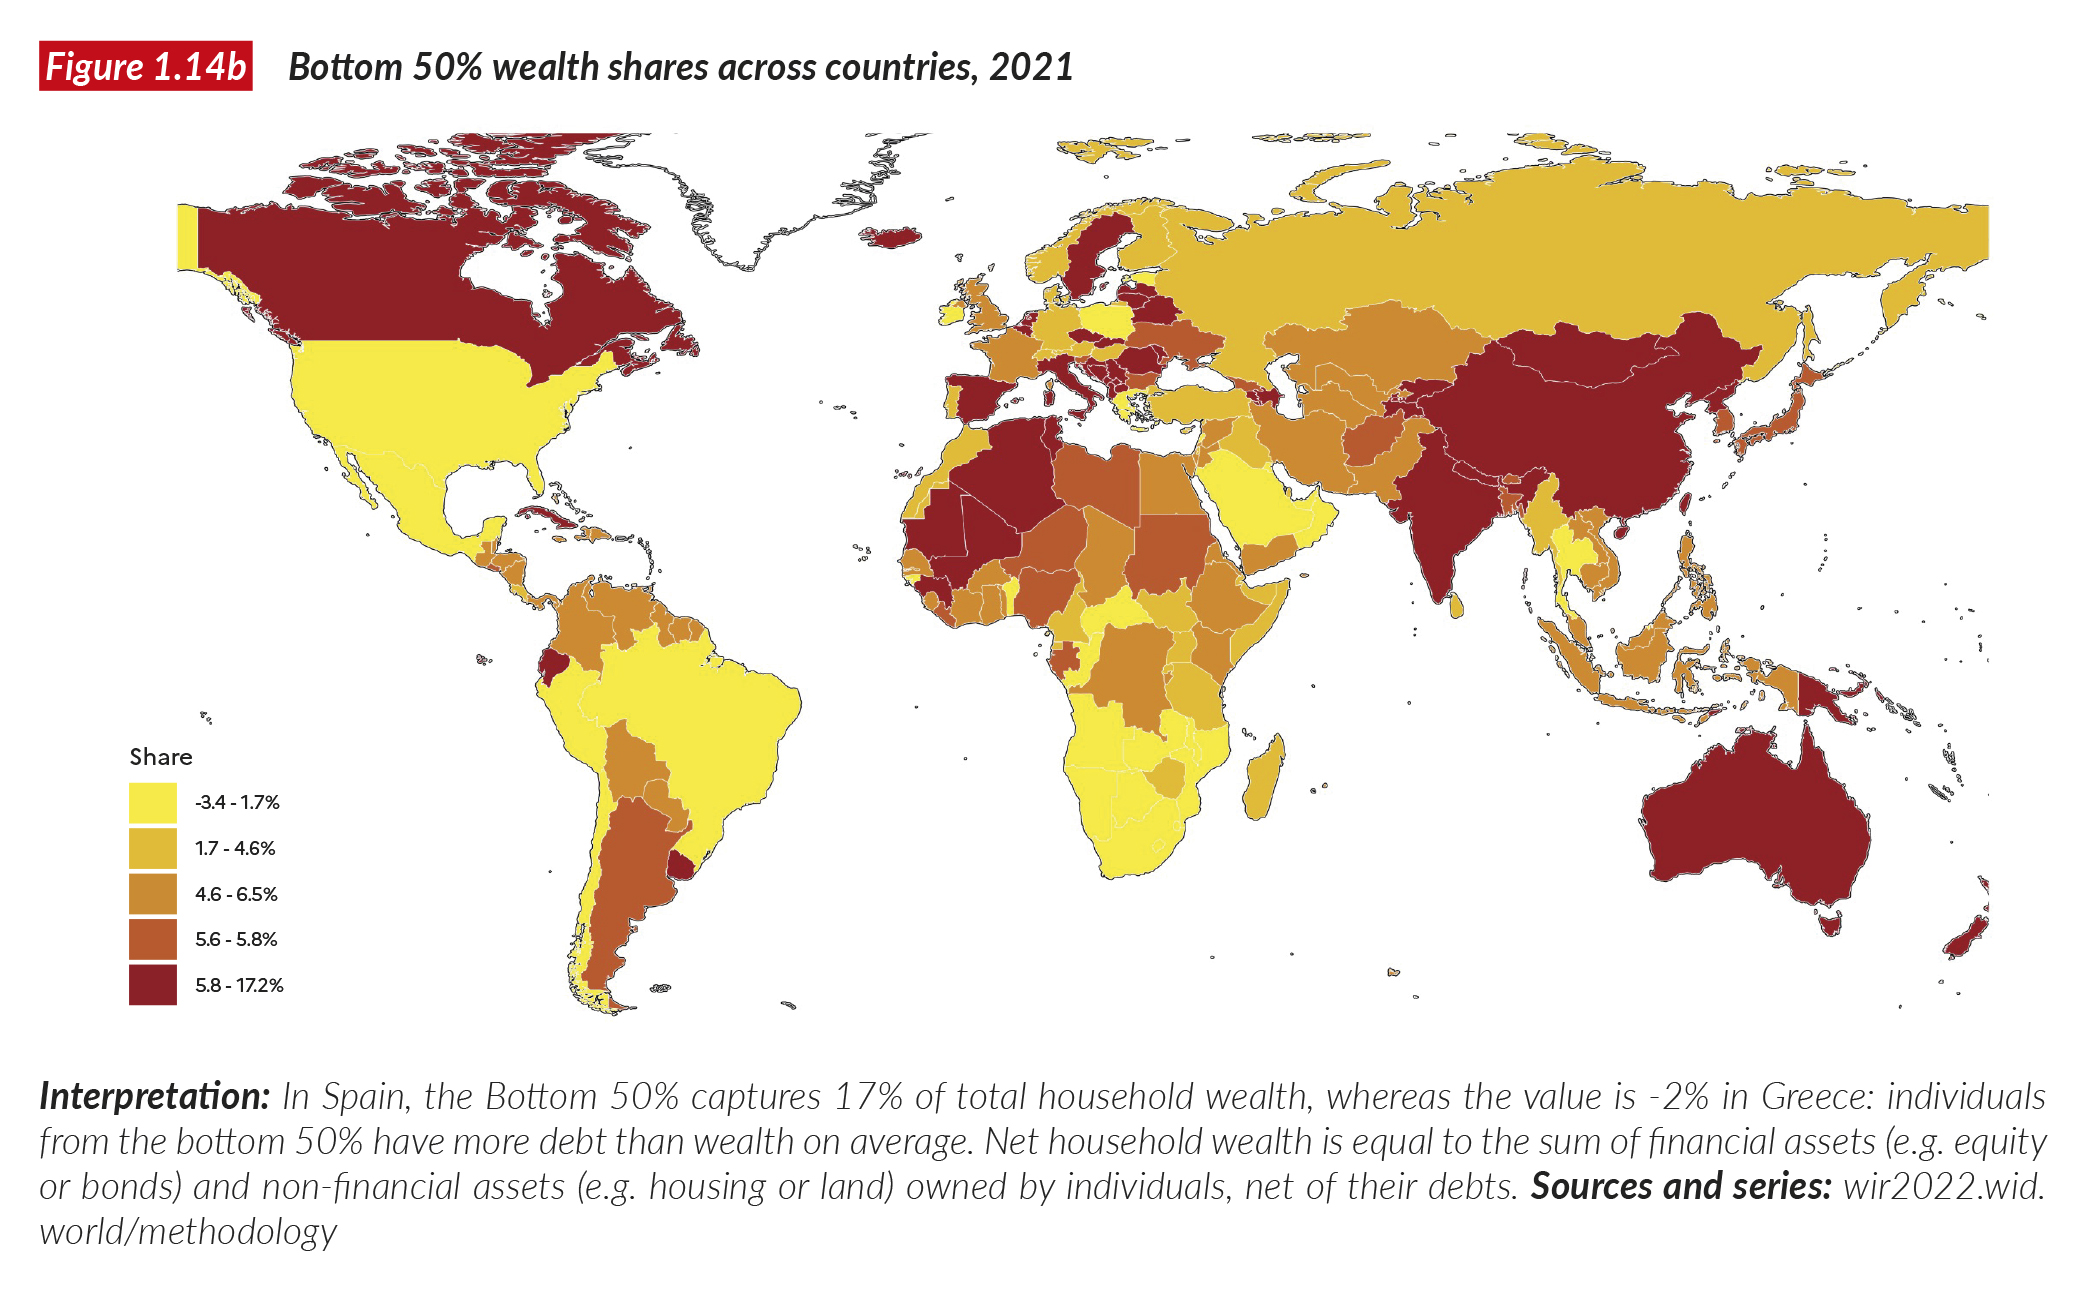
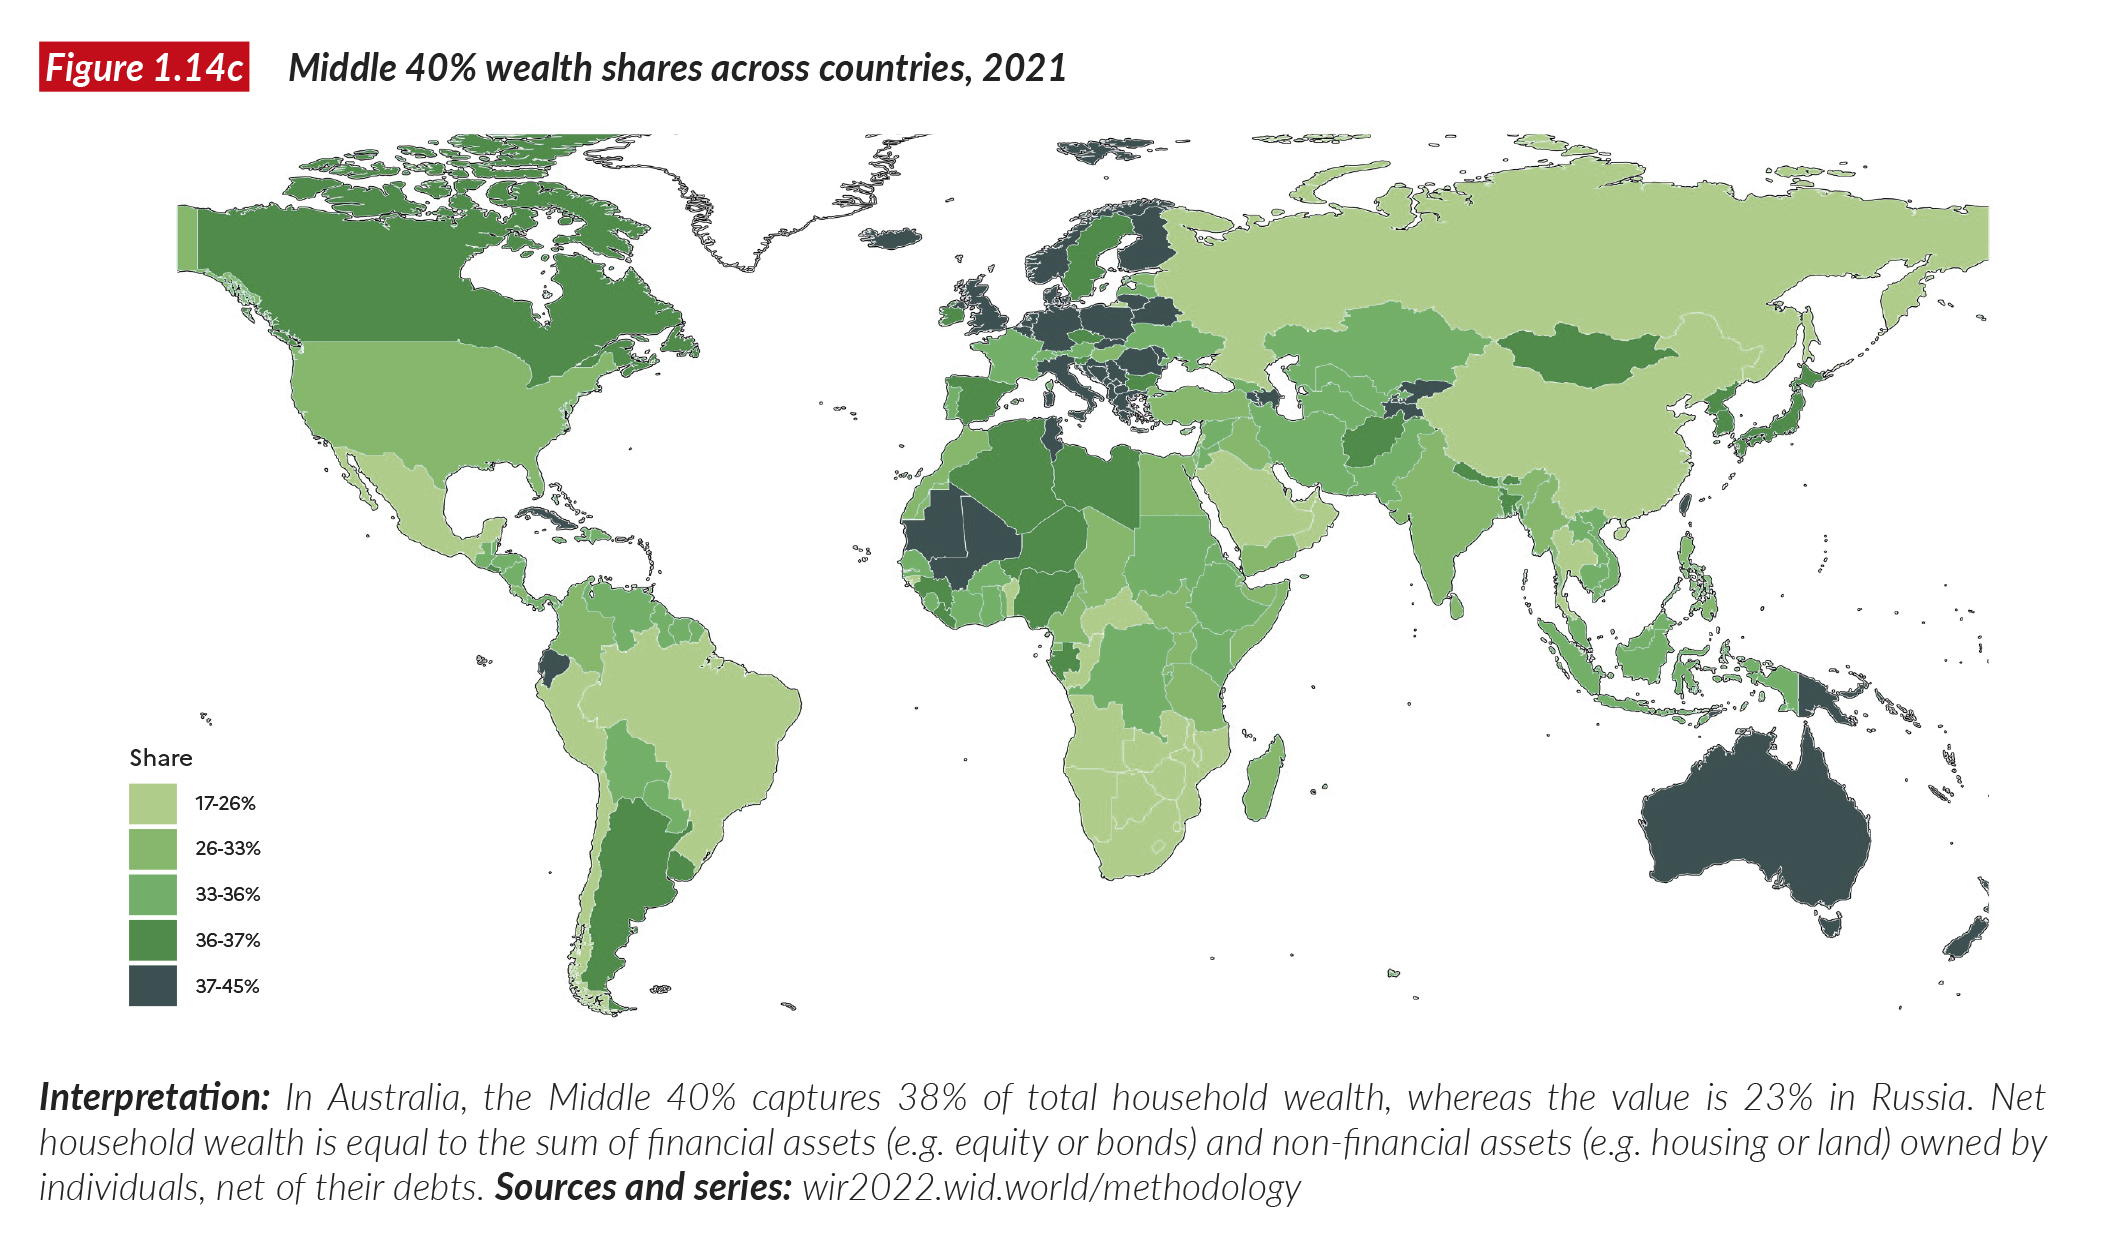
Figure 1.15 presents the global distribution of wealth and the size of the population of each world region at different levels of the wealth distribution.
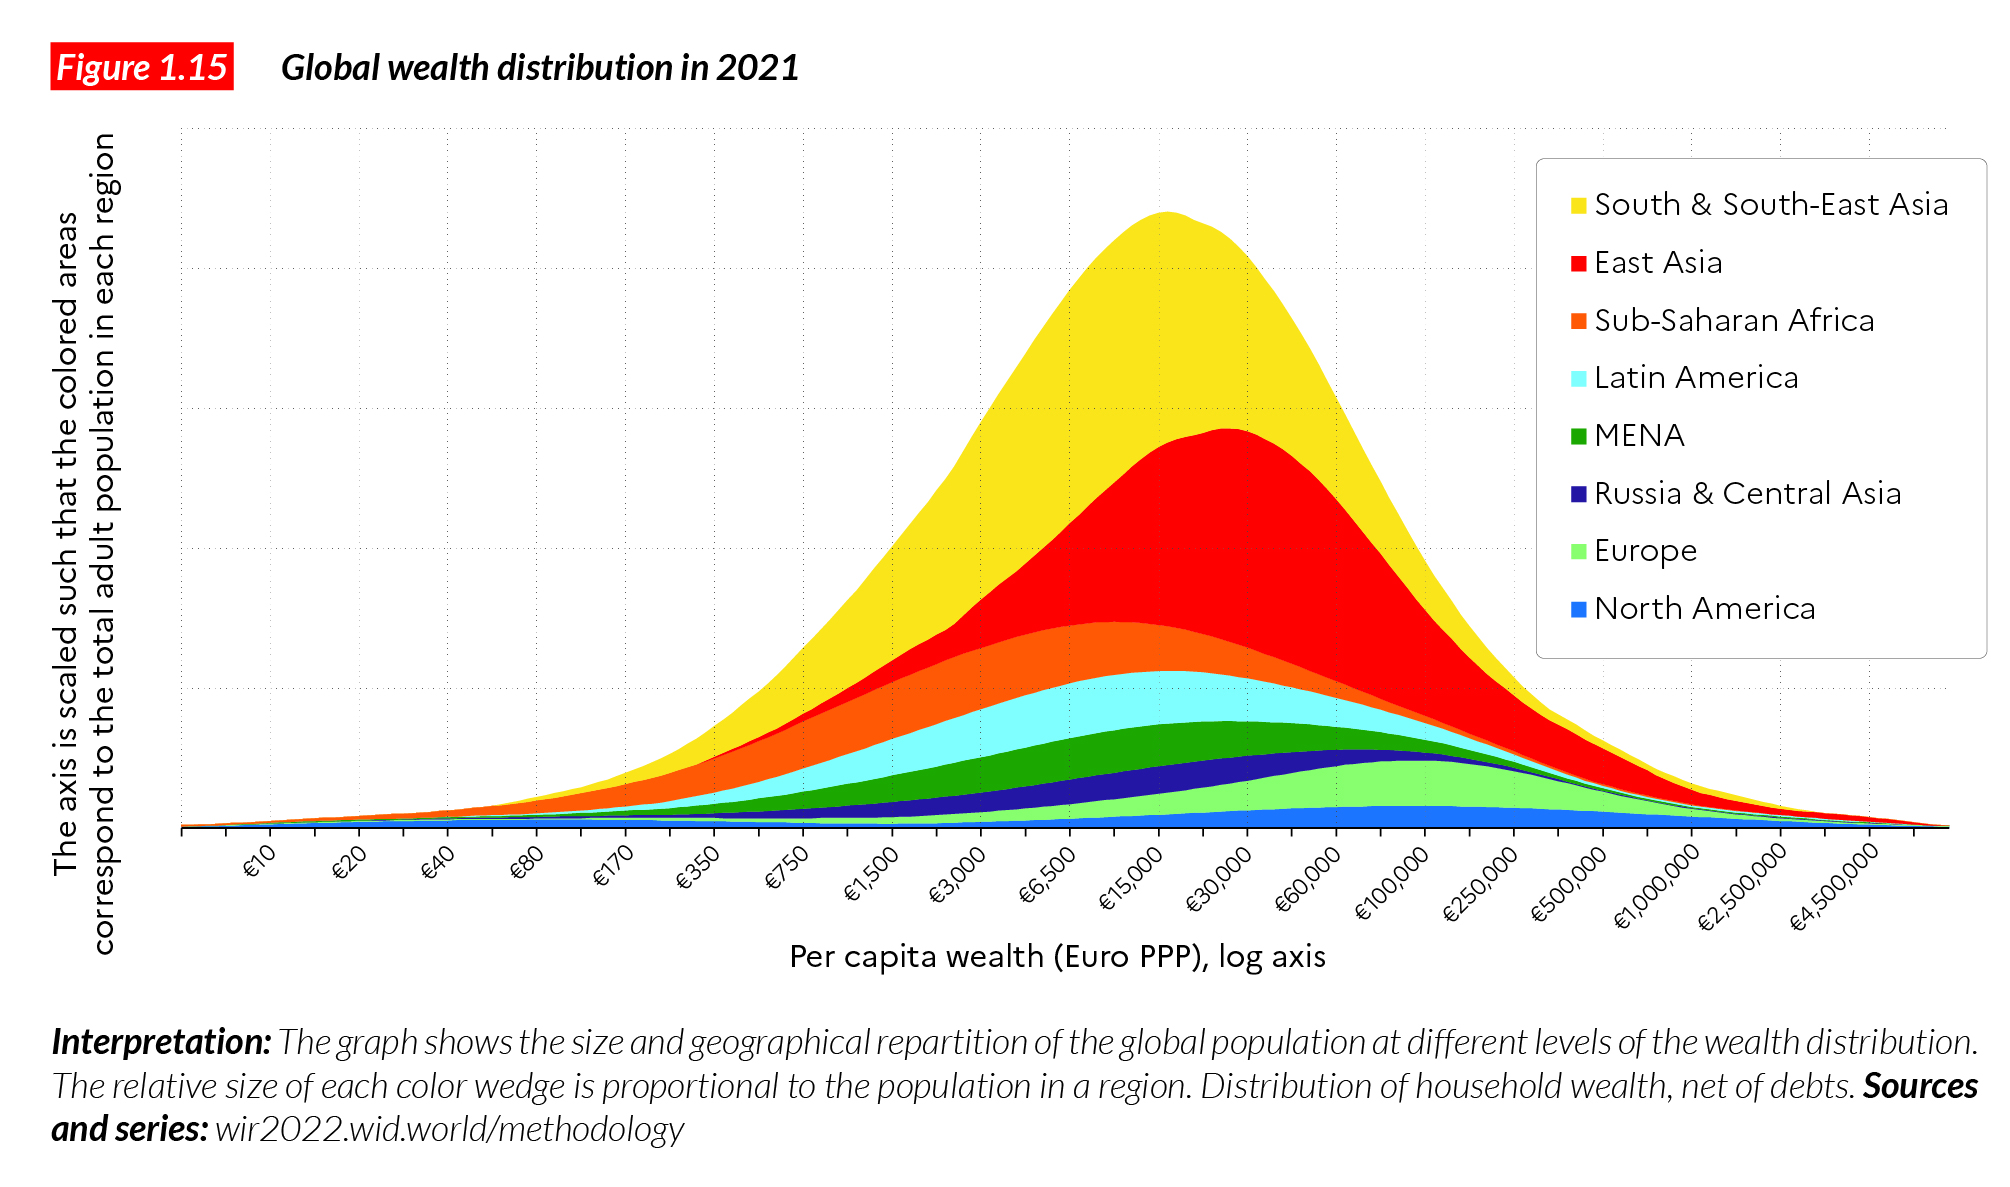
Figure 1.16 provides a geographical breakdown of the global wealth distribution.
Box 1.1 Income and wealth inequality concepts used in this report
There are different ways to define the income of individuals and therefore multiple ways to measure inequality, depending on the concepts of income used. To some extent, the same is true for wealth. When making international comparisons of income or wealth inequality levels, it is essential to measure the same concepts across countries to avoid any misleading conclusions.
The international network of researchers associated with the World Inequality Database (see Box 1.2) works hard to ensure that the income concepts presented in this report can be compared from one country to another and that they correspond to internationally recognized standards. Our benchmark income concept corresponds to the value that individuals read on their pay checks in many countries across the world, i.e. it is income measured before income and wealth taxes and after the operation of pension and retirement systems. We call this “post-replacement, pre-income tax” income. Another important income type corresponds to income measured after all income, wealth and consumption taxes are deducted, and after all non-replacement transfers (e.g. healthcare, disability and housing benefits) are added. We call this “post-tax income”. In this report, we alternate between the two concepts, using “post-replacement, pre- income tax” as the benchmark. As a general rule, we report incomes of adult individuals only and we split incomes equally between married couples.
Household wealth is defined as the sum of financial assets (e.g. deposits, stocks, bonds, equity) and non-financial assets (e.g. housing, business), net of debts, possessed by individuals. Interested readers should refer to the World Inequality Database and the Distributional National Accounts Guidelines for a discussion of the methods and other concepts associated with the data presented in this report.
The report contains several QR codes, which direct readers to relevant sections of the World Inequality Database. By clicking on the codes, readers will access additional methodological information, as well as the latest updates of the data presented in the report
Box 1.2 The WID.world and Distributional National Accounts Project
The World Inequality Database and the Distributional National Accounts Project
Producing inequality data in a context of extreme data opacity is difficult and so results are necessarily imperfect and preliminary. And yet, income and wealth dynamics must be tracked as systematically as possible. The World Inequality Lab seeks to combine different data sources in a fully transparent and consistent way in order to map the distributions of national income and national wealth. We also work hard to publish all this information online, and in open-access form on the World Inequality Database (WID.world).
The Distributional National Accounts project originates from renewed interest in the use of tax data to study the long-run dynamics of inequality, following the pioneering work on income and wealth inequality series developed by economists Simon Kuznets, Anthony Atkinson and Alan Harrison14. Top income shares, based on fiscal data, were initially produced for France and the US by Thomas Piketty and Emmanuel Saez, and rapidly expanded to dozens of countries, thanks to the contribution of over 100 researchers involved in the World Inequality Database and its earlier version, the World Top Income Database15. These series had a very great impact on the global inequality debate because they made it possible to compare the income shares of top groups (for example, the top 1%) over long periods of time, revealing new facts and refocusing the discussion on the rise in inequality seen in recent decades16.
More recently, the Distributional National Accounts project, led by the World Inequality Lab, in partnership with a number of national statistical offices and international organizations, has sought to go beyond the study of top income shares to produce estimates consistent with macroeconomic growth rates. The objective is to be able to produce annual income and wealth growth rates of different groups of the population alongside the publication of growth statistics by governments every year. Without such data, it is impossible really to know which social groups are losing and which are winning from economic policies.
The complete DINA methodological guidelines, as well as all computer codes and detailed data series and research papers, are available online on WID.world17 We summarize some of the methods below. The basic principle of the DINA project is that properly tracking income and
wealth dynamics requires a systematic and transparent combination of different data sources, including fiscal, survey, wealth and national accounts data.
Household surveys have been used as the standard source to track income and wealth inequality over the past decades. While they provide a rich set of socio-demographic information about respondents, these sources tend to misrepresent top income and wealth levels in a population (due to misreporting and statistical biases). Because of this, inequality estimates in certain countries are at odds with the actual dynamics of income and wealth.
To track the evolution of top incomes and wealth, administrative data on income and wealth (e.g. data from tax authorities) tend to be more reliable sources of information than surveys. Unfortunately, in many countries these sources provide information on only a subset of the population— namely, those who file tax returns. Another limitation of tax data is that they are subject to changes in fiscal concepts over time and across countries. Typically, depending on whether income components (such as labor income, dividends, and capital income) are subject to tax, they may or may not appear in the tax data from which distributional statistics can be computed. These differences can make international and historical comparisons difficult.
The DINA project provides a series of systematic rules and methods to reconstruct comparable estimates. To some extent, the harmonization problems can be resolved by using national account data—and in particular, the concepts of national income and national wealth—as a benchmark. Our choice of these concepts for the analysis of inequality does not mean that we consider them perfectly satisfactory. On the contrary, our believe that national accounts statistics are insufficient and need to be greatly improved.In our view, however, the best way to improve on the national accounts is to confront them with other sources and to attempt to distribute national income and wealth across income and wealth groups. The key advantage of national accounts is that they follow internationally standardized definitions for measuring national economic activity. As such, they allow for a more consistent comparison over time and across countries than do fiscal data. National accounts definitions, in particular, do not depend on local variations in tax legislation or other parts of the legal system. They are the most widely used concepts for comparing economic prosperity across nations.
Today, the World Inequality Database brings together over 100 inequality scholars located on all continents. We work hand in hand with partner research groups (see Box 1.3), statistical institutions and international organizations to define internationally agreed standards, and to improve statistical capacities all over the world.
Box 1.3 The rich ecosystem of global inequality data sets
There are many different inequality databases across the world and even more research groups working on inequality.These inequality databases include, for instance, the World Bank’s PovcalNet, which provides consumption inequality data from household surveys; the Luxembourg Income Study (LIS), which harmonizes a great deal of detail, income and wealth concepts using household surveys; the OECD Income Distribution Database (IDD) with distributional survey data for advanced economies; the University of Texas Income Project Database using industrial and sectoral data to measure inequality; and the Commitment to Equity Database (CEQ), which provides information on tax incidence, i.e., the impact of taxes and transfers on different income groups. The UNU- WIDER’s World Income Inequality Database provides income inequality data sets for a vast number of countries. There are also relatively detailed regional databases such as the Socio-Economic Database for Latin America and the Caribbean (SEDLAC), and the European Survey of Income and Living Conditions database.
These databases have proven extremely useful to researchers, policymakers, journalists, and the general public interested in the evolution of inequality over past decades. There does not exist and there will never exist one perfect database on inequality: the different data sets bring complementary insights into inequality, and whether one should use one or another largely depends on the specific issues one wants to study. Some, like PovCalNet are relied upon to compute global poverty measures. Others, like the LIS database, have been used by generations of researchers to study economic inequality and its interactions with other dimensions of welfare, from an international perspective. Regional databases like SEDLAC and EU- SILC enable detailed regional analyses of inequality, while the CEQ database can be used to analyze the impact of tax and transfer policies.
A central issue for most of these sources is that they essentially rely on a specific information source—namely, household surveys—which are critical for measuring income and wealth inequality, but which also have important limitations. Household surveys consist mostly of face-to-face or virtual interviews with individuals who are asked questions about their incomes, wealth, and other socio-economic aspects of their lives. Surveys are particularly valuable because they gather information about not only income or assets, but also about social and demographic dimensions. They thus allow for a better understanding of the determinants of income and wealth inequality, and help to place income and wealth inequality in broader contexts— including racial, spatial, educational, and gender inequality.
The main problem with household surveys, however, is that they usually rely entirely on self-reported information about income and wealth. As a consequence, they tend to misrepresent top income and wealth levels, and therefore overall inequality. This can also contribute to inconsistencies between macroeconomic growth (as recorded by GDP statistics) and household income growth (as recorded by surveys for the bottom and middle parts of the distribution). The World Inequality Database seeks to address this issue by combining, in a systematic manner, household surveys, administrative data, rich lists, and national accounts – to bridge the gap between micro-economic statistics and the study of income and wealth economic growth.Over the years, researchers associated with the WIL have developed many partnerships and projects with other inequality data providers (e.g. LIS, CEQ, PovCal) in order to develop synergies and to improve global public statistics. The WIL has also developed partnerships with national and international statistical organizations (e.g. the United Nations and several national statistical offices and tax authorities) to develop new international inequality measurement standards, in the context of revisions of the national accounts system18.
Box 1.4 Impact of the Covid crisis on inequality between countries
The global Coivd-19 pandemic and the economic crisis that followed hit all world regions, but it hit them with varying intensity. Europe, Latin America, and South and Southeast Asia recorded the largest drops in national income in 2020 (between -6% and -7.6%) while East Asia (where the pandemic began) succeeded in stabilizing its 2020 income at the level of 2019. What has happened in the year 2021? Growth estimates are largely projections (based on April 2021 IMF forecasts, published before the rapid development of the Delta variant in the summer of 2021). It is quite clear, though, that the effects of the economic crisis continue to be unequally distributed across the world in 2021. In East Asia, projected growth for 2021 is 8% higher than in 2019, whereas Latin America will continueto suffer severely from the economic crisis (-6% growth). Europe is also projected to have lower incomes in 2021 than in 2019, but this region nevertheless shows a significant improvement over the 2020-2019 situation (-2%in 2021-2019). Other regions are expecting positive 2021-2019 growth, in contrast to with their negative values over 2020-2019 (see Figure B1.1).
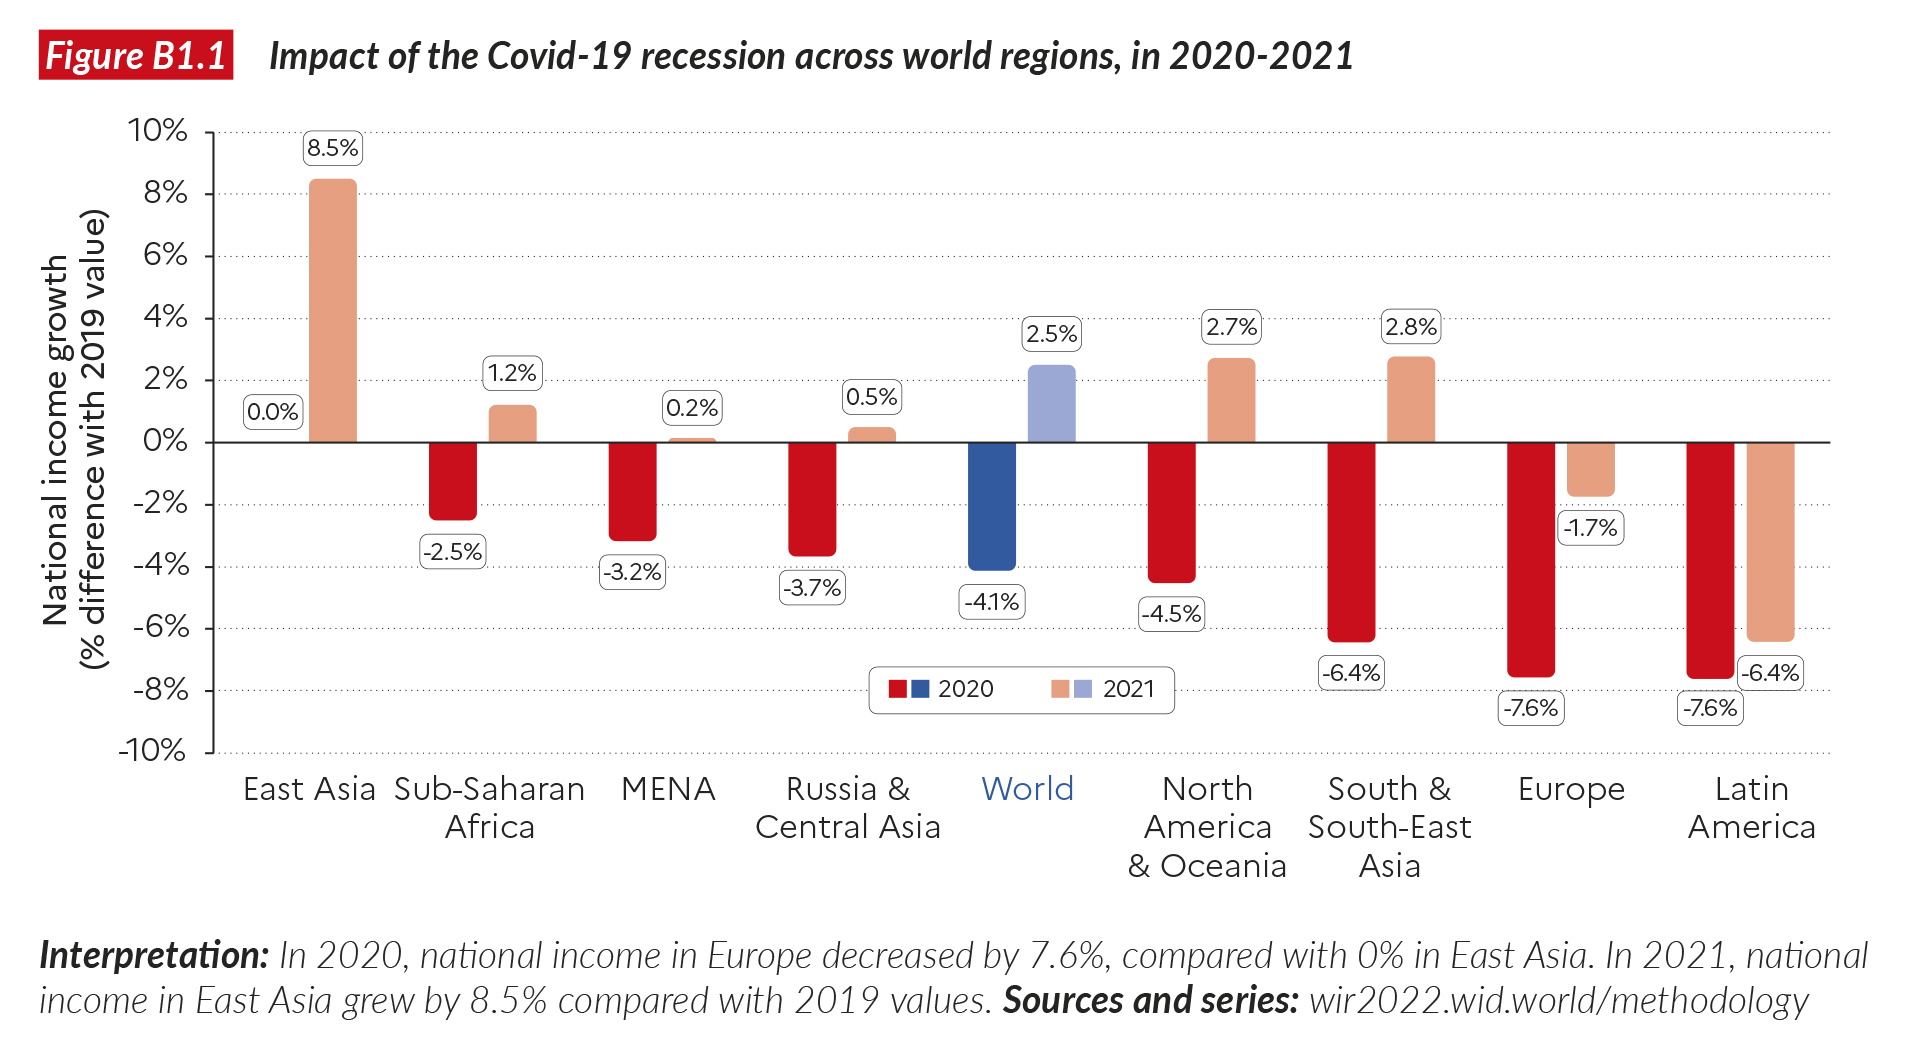
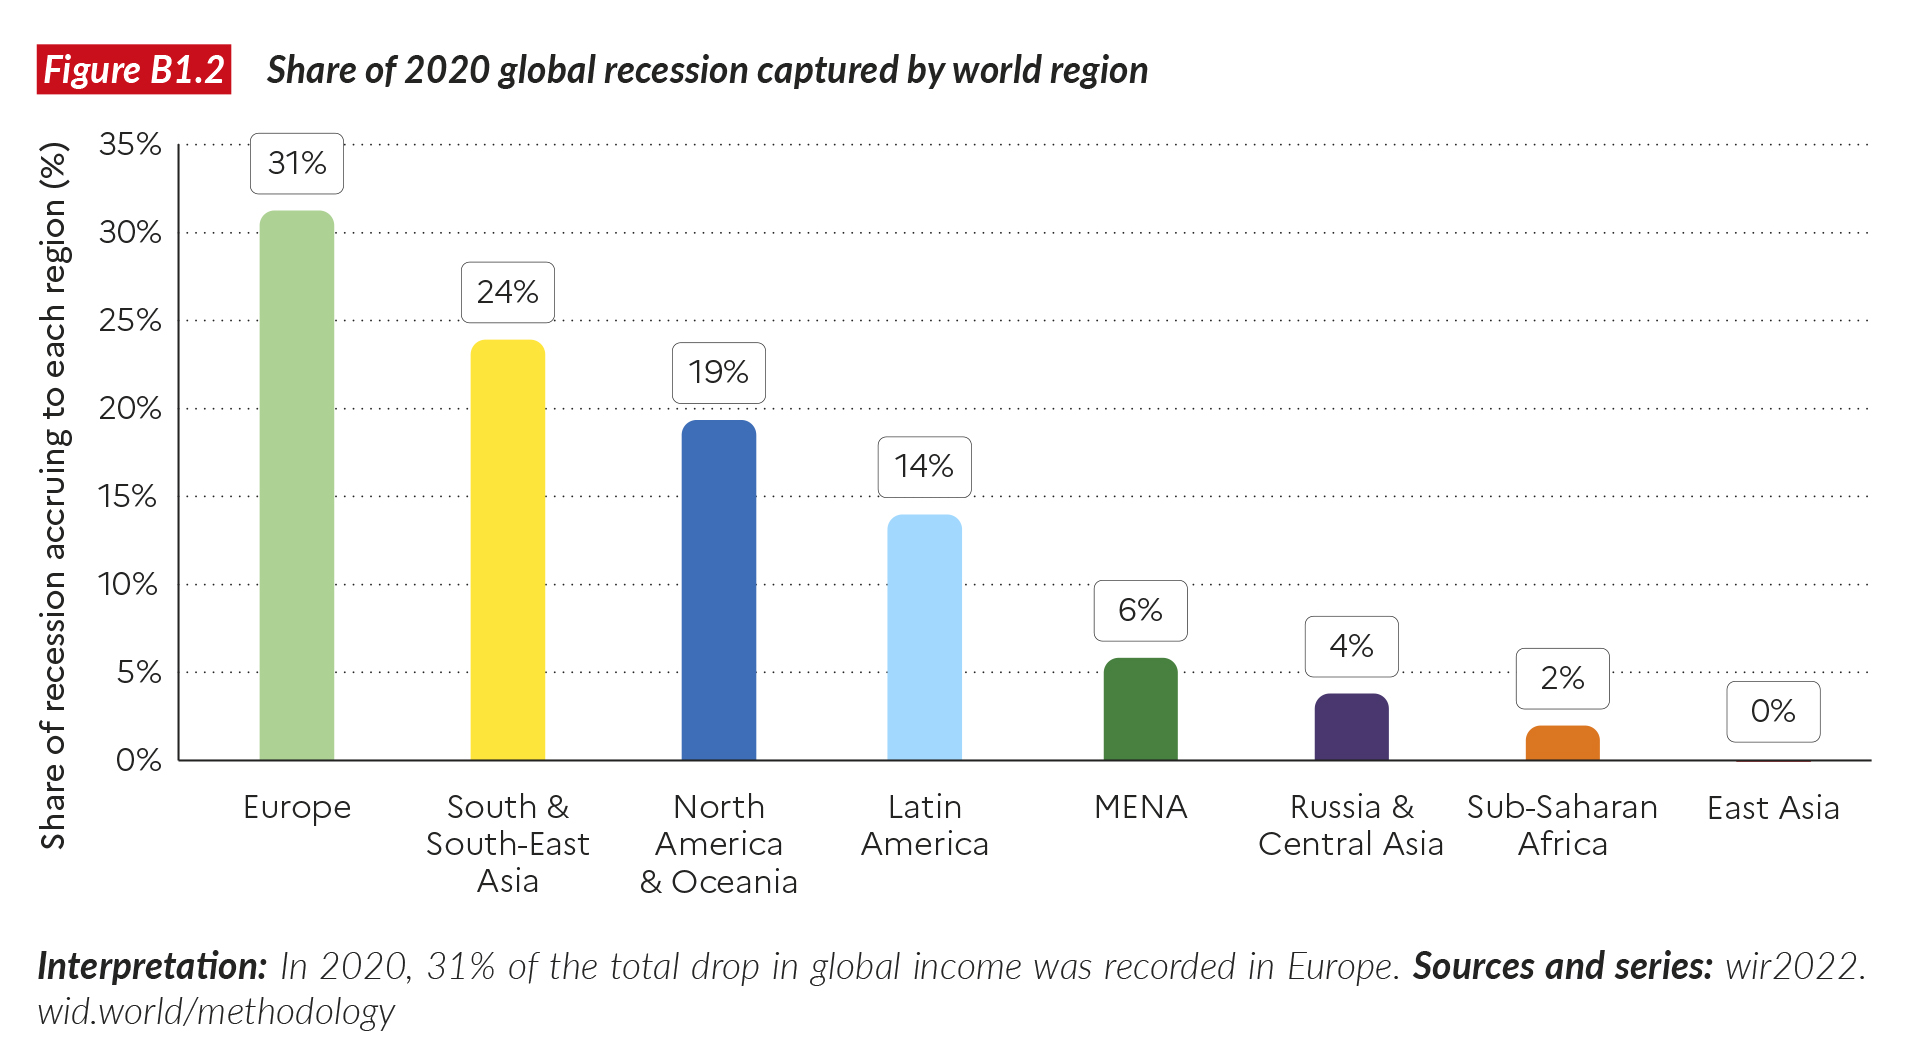
Figure B1.2 shows how much of the drop in global income in 2020 occurred in each region. Europe and North America both experienced a little less than half of the average drop in global income (with 30% and 17% of the total recession, respectively), while South and Southeast Asia, Latin America, the Middle East and North Africa and Central Asia all took a similar share of the global recession. So, what was the impact of the recessionon global inequality between countries? To the extent that about half of the drop accrued in rich countries and the otherhalf in low-income and emerging regions,no clear pattern emerges in the global top 10% income share. If anything, the share of the global bottom 50% halted its progression. We observe that this dropis entirely due to the impact on South and Southeast Asia, and more precisely on India. When India is removed from the analysis, it appears that the global bottom 50% income share actually slightly increased in 2020. These estimates assume that inequality within countries in 2020 has not been affected by the Covid crisis (see Box 1.5 for a discussion of known impacts within countries ).
Box 1.5 Impact of the Covid shock on inequality within countries
The Covid-19 pandemic has exacerbated several forms of health, social, gender and racial inequality within countries. It is still too early for a systematic understanding of the intra-country impact of the crisis on income and wealth inequality due to the lack of real-time data on the distribution of growth across all countries.
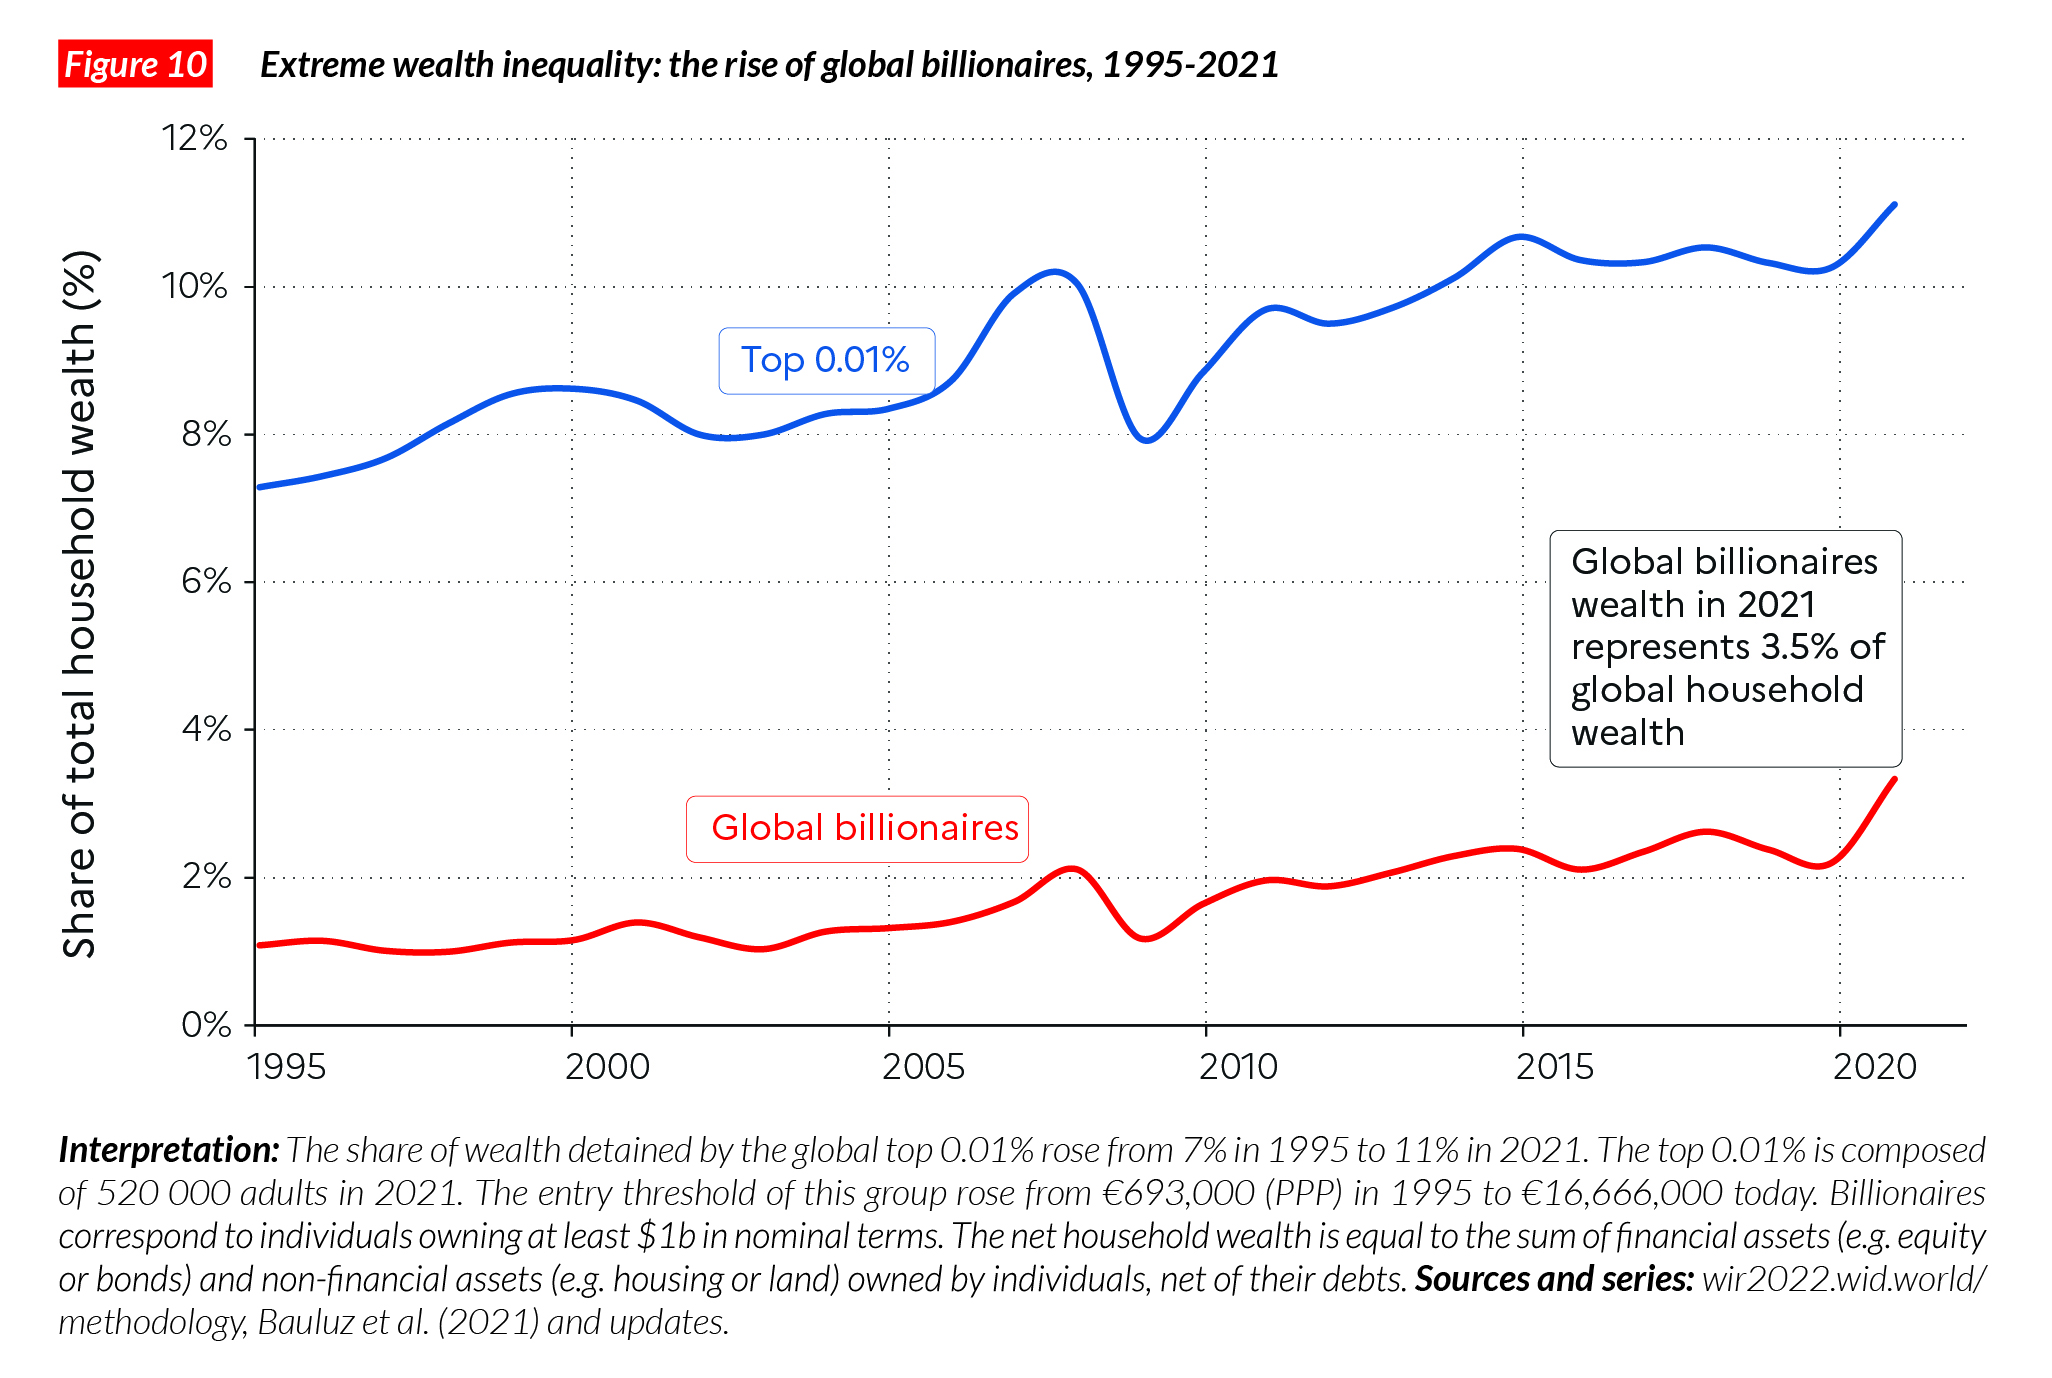
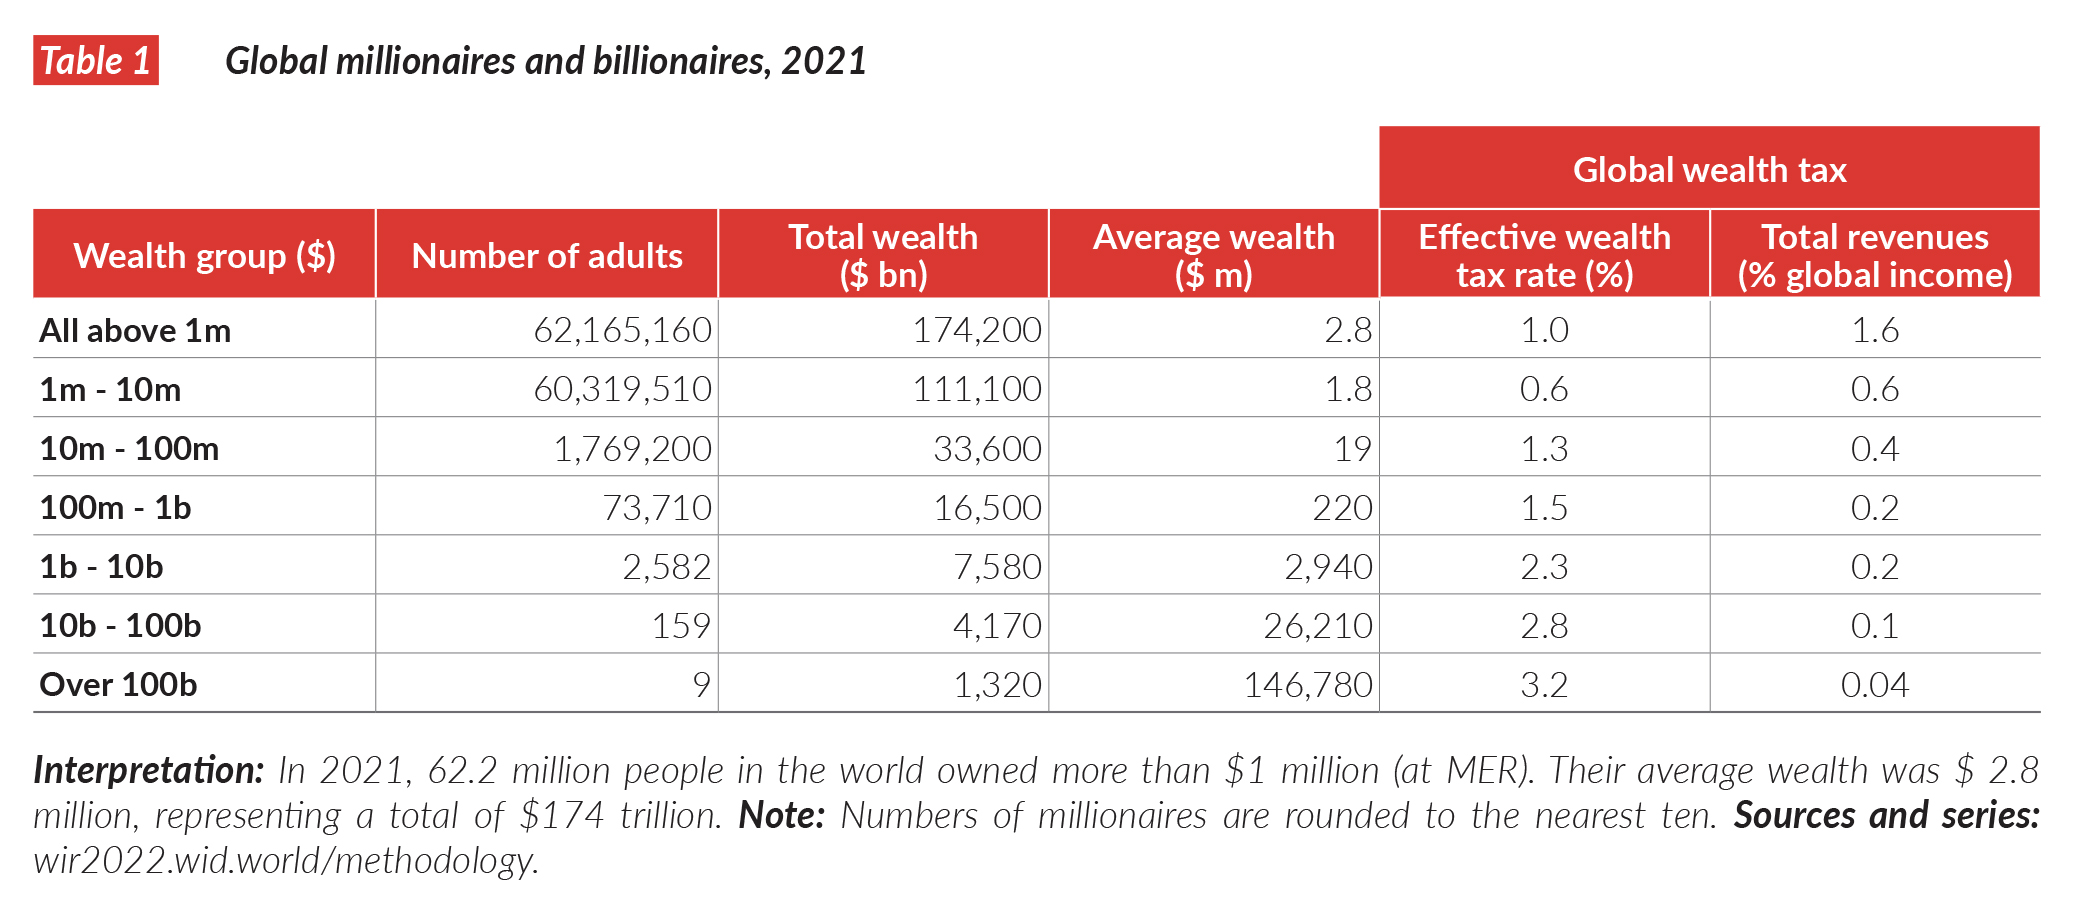
However, some high-frequency data sources help us to understand the interplay between the Covid crisis and inequality within countries. From billionaire wealth records, we observe, for instance, that the gap between the very top of the wealth distribution and the rest of the population has widened dramatically during this pandemic. Between 2021 and 2019, the wealth of the top 0.001% grew by 14%, while average global wealth is estimated to have risen by just 1%. At the top of the top, global billionaire wealth increased by more than 50% between 2019 and 2021 (more on this in Chapter 4).
Income inequality data generally come less frequently than billionaire wealth data from rich lists. At this stage, it is therefore too early to produce global income inequality estimates that properly take into account the effect of Covid on income inequality within countries, but some country-level studies provide useful insights into these dynamics.
In certain high-income countries, real-time income and savings data are available and are already very informative. Studies reveal that the pandemic initially affected low-income and wealthy groups disproportionately but that government responses were able to counter this effect. In the US, for instance, Chetty et al. show that employment rates fell by 37% around the trough of the COVID recession (April 15, 2020) for workers paid wage rates in the bottom quartile of the pre-COVID wage distribution, while employment fell by 14% for those in the top wage quartile19. At the same time, the implementation of exceptional crisis responses in the US (including direct special payments to households, unemployment benefits, and food stamps) is found to have had a substantial impact on poverty in the US. According to the Urban Institute, According to the Urban Institute, poverty dropped by 45% in 2020-2021 measured against 2018 levels (20 million people escaped absolute poverty in the US over the period)20. This shows that Covid-related policies were critical to countering a rise in inequality and also that persistent poverty is not inevitable: it can indeed be countered with bold social policies.
In Europe, studies using micro-simulations and longitudinal surveys suggest similar results, i.e. without policy responses, a strong increase in income inequality would have occurred, but government support (partial unemployment guarantee, exceptional relief, etc.) tempered this impact and sometimes reduced income inequality21. Data on household savings show substantial inequality in the capacity to accumulate wealth during the pandemic ,nevertheless. High income groups were able to save significantly more than other groups. In France, Bounie et al. , found that aggregate savings significantly increased in 2020 because of the lockdown22. Top wealth groups represent the bulk of this savings increase, and were able to reduce their debts over the course of 2020, while the bottom 10-20% of the distribution actually increased their level of indebtedness.
One important remark should be made at this stage. The large stimulus packages implemented by rich countries were both essential and successful in preventing a sharp rise in poverty and inequality at the bottom of the distribution. It should be noted, however, that these programs were costly and increased public debt by the order of 5-20% of national income (See Chapter 3). This public debt will have to be repaid by individuals in one way or another. At this stage, no one knows how this debt will be repaid. Different strategies can be pursued and each of them will have different consequences for the overall impact of the pandemic on inequality. The impact might be felt over several years or decades, as has been the case with major economic shocks in the past. Governments could, for instance, be tempted by a mix of austerity measures (such as were imposed in the aftermath of the 2008 financial crisis) and regressive taxes (such as increased value-added taxes), which would disproportionately hurt low-income groups. Conversely, should governments implement progressive taxes or pursue partial debt cancellations or restructuring, these measures would help to lower inequality. It is too early to say which of these paths will be followed.
In emerging countries, where social security systems are less developed, the effect of the pandemic on low-income groups has been more severe23. The World Bank estimates that the pandemic drove about 100 million people into extreme poverty, raising the global total to 711 million in 2021, up from 655 million in 2019. Without this crisis, the number of people in extreme poverty in 2021 would have been 613 million24.
Looking at inequality across the entire population, the International Monetary Fund has also estimated that, in 2020, income inequality grew in emerging markets and low-income countries as a consequence of the Covid crisis25. It could increase to a level comparable to that in 2008, reversing all gains made since then. In these countries, fiscal resources and borrowing capacities remain low, safety nets are patchy, and social protection programs sometimes almost non- existent.
Generally speaking, the weaker the social protection system, the more unequal the impacts of a crisis are likely to be, and households that have relatively limited access to markets, capital, and basic services will be most severely hit. Studies suggest that the early phases of the pandemic (the lockdowns) had a greater effect on vulnerable individuals, including those on lower incomes and with lower education levels, minorities, and women. In developing countries, informally employed workers tend to face a higher risk of losing their jobs than workers with formal contracts26. However, evidence in developing countries, and particularly low-income countries, remains incomplete due to the paucity of data on informal labor income, despite recent efforts to improve the measurement of distributional effects, such as the UN’s Socio-Economic Impact Assessment conducted in several emerging countries during the crisis27. Such studies support the assumption that the pandemic has resulted in a loss of household labor income, both formal and informal, a decline in remittances, and price inflation triggered by food price hikes, with spillover effects through rising household debt levels, unaffordable out-of-pocket payments for healthcare services, and reduced access to public healthcare and education. In other words, the crisis hit low- income households disproportionately hard.
The World Bank has also set up a monitoring dashboard composed of harmonized indicators from high-frequency phone surveys conducted in over 45 countries in response to the Covid pandemic. These surveys show higher rates of income loss in low and middle-income countries than in high-income countries. These losses seem to be linked to the formality/informality of the labor market28. The farm vs. non-farm family business dichotomy might be another driver of increased inequality, pointing to the buffer role played by the agricultural sector.
At the other end of the distribution, it appears that emerging and low-income countries are no exception to the exceptional rise in top wealth inequalities observed over the period. While incomes dropped at the bottom of the distribution, capital rose steeply at the top.
Box 1.6 What is the relationship between Gross Domestic Product, National Income and National Wealth?
Economic growth is at the heart of contemporary economic policy debates. What does it mean exactly? “Growth” typically refers to the growth rate, or annual evolution, of Gross Domestic Product in a given country. Gross Domestic Product (GDP) is the value of all goods and services produced in an economy over a year, minus the value of goods and services needed to produce them, called intermediary production. Since its conceptual development in the 1940s, GDP has been criticized for its many limitations: it is blind to environmental degradation, it poorly captures variations in human well-being, and ignores inequality. Therefore, increases in GDP by no means indicate that the overall standards of living in a country are improving. This has led over the years to the creation of several alternative indicators, including the Human Development Index, which factors in education and healthcare, and GDP indicators that factor in environmental degradation.
In the aftermath of the 2008 financial crisis, a new wave of research and policy discourses, exemplified by the Stiglitz-Sen- Fitoussi Commission on measuring well- being, stressed the need to move beyond GDP29. Their report is fully in line with the work of the World Inequality Lab. We seek to improve measurement of inequalities in human well-being by looking at how economic production actually benefits different groups of individuals (rich and poor, men and women…), and also factoring in the environmental impacts of production. We stress however that economic growth indicators remain essential to studying inequality worldwide, but to do that, we prefer to use national income rather than GDP. Here is why: GDP not only has key limitations to its measurement of well-being for the reasons indicated above, but also has several pitfalls from a purely economic point of view. In particular, the indicator filters out the depreciation of capital used in production processes (not only for roads and computers, but also, in principle, for forests and other natural resources to the extent that their value can be monetized). Put differently, if a country increases its production by depleting its capital stock (its forests, for instance), GDP will grow, even though the country is arguably getting poorer. In addition, GDP is blind to flows of income coming in to the country from abroad and being sent out to other countries. In certain countries, outward flows reduce actual incomes received by nationals by a large margin, while in others, they increase income significantly. Typically, capital income flows go from poor nations to rich countries, which own capital abroad. It is essential to have a proper sense of these dynamics when looking at global inequality. National income is a better concept than GDP for studying global economic inequality because it takes into account both the depreciation of capital stock and net income flows from abroad. Formally, national income is equal to GDP minus the depreciation of the capital stock used in production processes, plus net incomes received from (or paid to) the rest of the world.
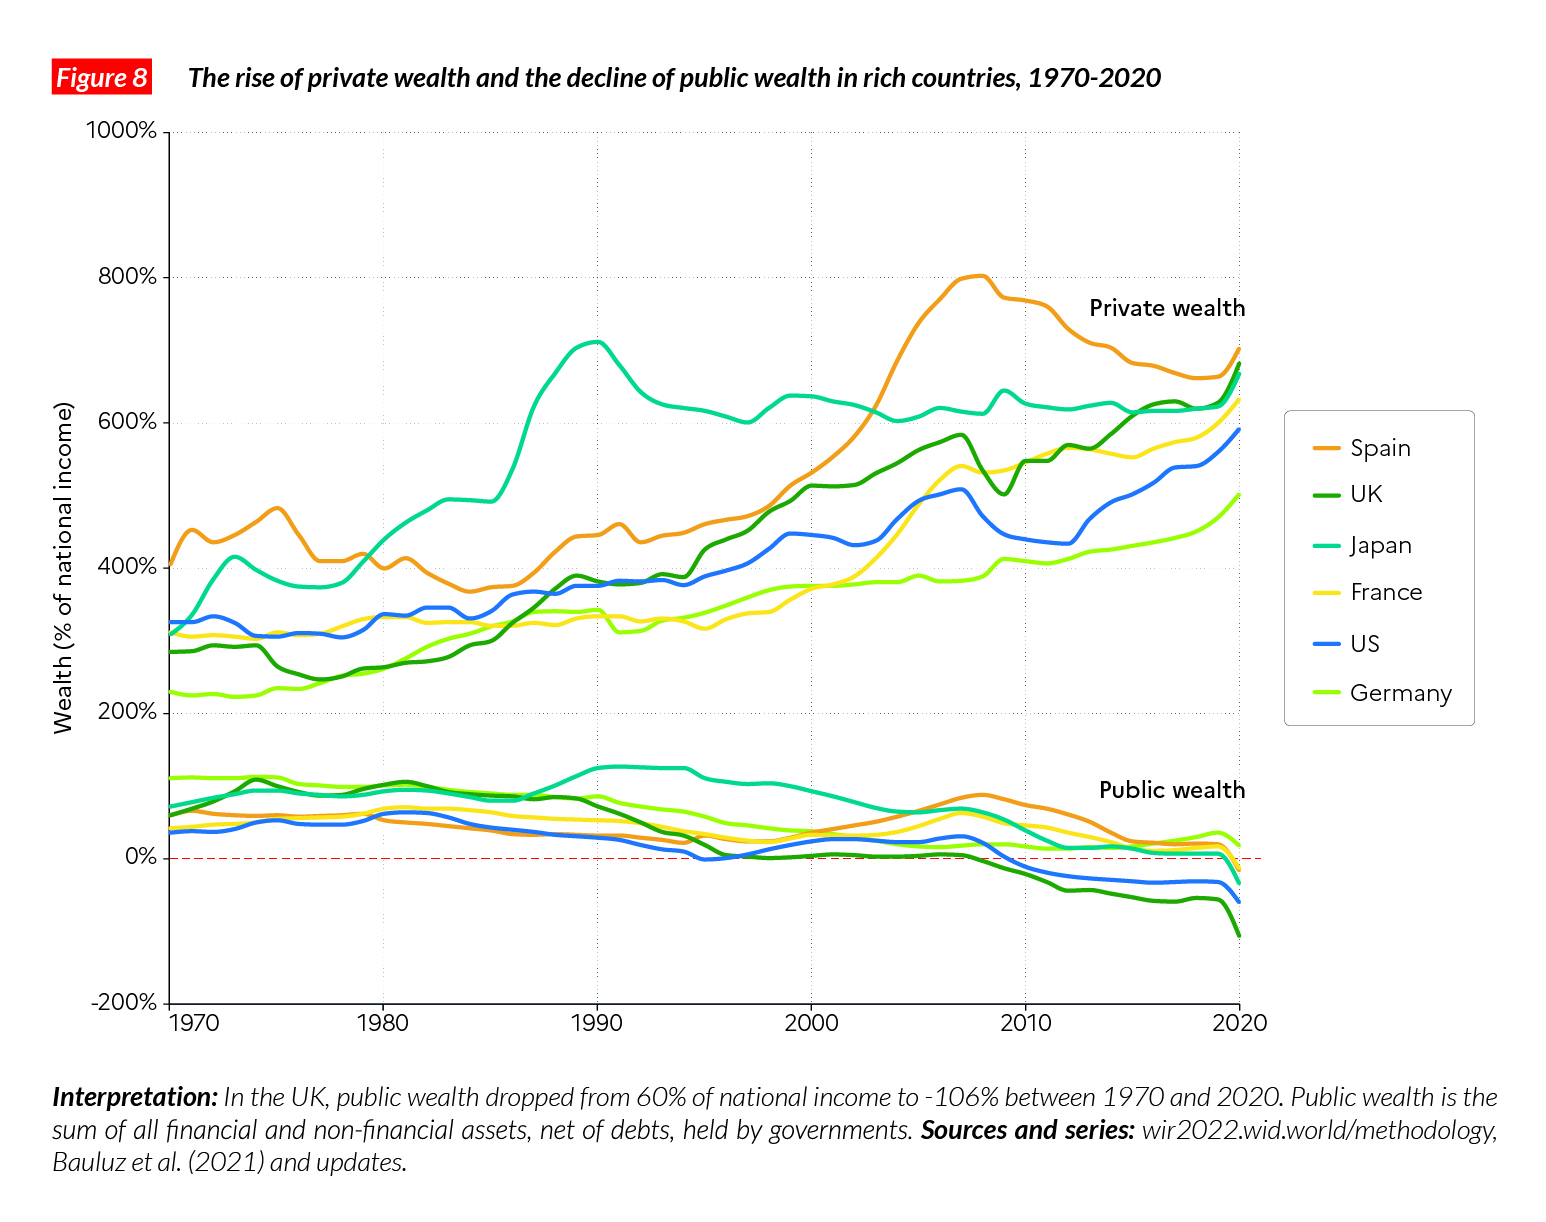
In addition to national income, it is also crucial to focus on national wealth to fully understand the level and dynamics of global economic inequalities. Income is a flow, wealth is a stock. National wealth is equal to the stock of assets owned by nationals of the country (both in that country and abroad). This wealth can be privately owned (by individuals) or publicly owned (by the state). Studying the dynamics of wealth is necessary to understanding contemporary debates about debt, the relative sizes of the public and private sector in the economy, the amount and the quality of infrastructure (public schools, roads, hospitals), and the role of inheritance in the reproduction of inequality. Focusing on the dynamics of national wealth inequality is also necessary to complement our understanding of income inequality, in particular at the top of the distribution. Recent debates about taxation reveal that some billionaires appear to pay low or no individual income taxes because they can report modest incomes relative to the size of their wealth30. In fact, many of these individuals have actually become richer (i.e. their wealth increased) thanks to capital gains (i.e. the value of their stock increased). In many countries, capital gains are not treated as taxable income until they are cashed (e.g. until shares are sold). Capital gains are also excluded from the measurement of GDP and national income because they reflect changes in asset values rather than new production. At the same time, when they increase individual wealth, they are a form of income in the pure economic sense of the term. This is also why it is necessary to complement our understanding of aggregate and distributional income measures with aggregate and distributional wealth numbers, as we do in this report.
Box 1.7 Comparing incomes, assets and purchasing power across the globeWealth?
How to compare income levels and asset ownership across the world, knowing that the costs of living differ so much between (and within) nations? Market exchange rates do not take into account these differences and hence may not properly account for inequalities in living standards across the globe. A standard way to compare inequality in purchasing power across the globe is to deflate (or inflate) incomes earned in a given country by the cost of goods and services in that country relative to that of others: Purchasing Power Parity (PPP). For instance, housing is relatively cheap in India compared with France, but red wine is relatively less expensive in France than in India. In order properly to compare costs of living across the world, we need information about both the relative prices of goods and services (e.g. wine and housing), and the relative volume of each good and service in the consumption baskets of individuals. This has been the aim of the International Comparison Programme (ICP) since the 1970s. The ICP combines the major international statistical agencies and statistical administrations of more than 190 countries. The group conducts surveys to collect prices and expenditure levels for various goods and services purchased across the world. Its last round was published in May 2020 using data on 2017. Such an enterprise is not perfect (in particular, numbers are national averages, while there may be strong regional variations, as well as differences across income groups) but they provide a better view of inequality in purchasing power than does income at market exchange rates.
At the same time, Market Exchange Rates (MER) can be useful (and increasingly so) for tracking global inequality. While PPP numbers give a more accurate picture of global inequality from the point of view of individuals who spend their incomes in their own countries, MER are perhaps more informative about inequality in a world where individuals can easily spend their incomes wherever they want. This is particularly relevant when one looks at the wealth of global multimillionaires or billionaires, who can easily buy goods and services all over the world. When comparing their wealth levels, it can make a lot of sense to look at MER.
Focusing on MER rather than PPP can also be useful when focusing on how tourists spend their incomes and anyone making purchases in other countries via the internet. MER are also useful when focusing on the incomes of migrants and workers sending remittances back to their home countries.
To summarize, both purchasing power parity and market exchange rates can be valid measures for tracking global income and wealth inequalities, depending on the object of study, or on which countries are being compared. In this report, we generally use purchasing power parity for income comparisons, and a combination of MER and PPP for wealth in order to provide as complete a view of inequality as possible.
1 In this report, and unless stated otherwise, we express incomes in terms of Purchasing Power Parity (PPP), i.e. we take into account differences in the cost of living across countries when we compare incomes earned in different parts of the world. At PPP, EUR 1 = USD 1.4 = CNY 5.0.
See Box 1.7 on purchasing power parities.
2This value is expressed at PPP. At Market Exchange Rates (MER), global wealth is equal to €392 trillion. At MER, EUR1= USD1.2 = CNY7.
3 Global net wealth is the sum of global net private wealth and global net public wealth. Global net private wealth is equal to the sum of all financial and non-financial assets, net of debts, held by the private sector. See Chapter 3.
4Children generally generate very little or no income and have very little wealth. This is why we focus on the adult population. Of course, the welfare of children and whether they grow up in poor or affluent families is also very important as well but outside the scope of this report.
5 Naturally, not all couples share economic resources equally but data on intra-family resource sharing is scarce. Some of our statistics, however, will focus specifically on the gender gap in labor income, where we attribute labor income to the person who earns it (without splitting it within couples).
6 Unless stated otherwise, all values are expressed at Purchasing Power Parity.
7 In Bangladesh, Myanmar, and South Africa, full-time employees work around 2,100 hours per year, compared with 1,600 in rich countries. In Europe, employees work around 1,550 hours per year compared with 1,750 hours in the US. See Feenstra, R. C., R. Inklaar and M. P. Timmer. 2015. «The Next Generation of the Penn World Table.» American Economic Review, 105(10), 3150-3182.
8 Especially when controlling for time spent at work differences.
9 Beyond healthcare contributions, all “non-contributory social contributions” are taken into account at this stage; these are all social contributions, except those which contribute to the financing of delayed incomes (i.e. retirement income or unemployment insurance, which we do not count as redistribution strictly speaking).
10 In order to compare inequality levels across the world, it is arguably better to focus on redistribution independent of the pension and unemployment insurance system. Indeed, before the operation of the pension schemes, retired individuals in countries with large public pension schemes have virtually no income and appear extremely poor in statistics. In these countries, prior to tax and pension transfers, inequality would seem to be extremely high (to a large extent for artificial reasons). After pension transfers, these individuals have an income and inequality levels drop. The drop in inequality is particularly large in countries with many elderly and hence is very sensitive to aging patterns. We choose to use pre-tax income after the operation of pensions systems precisely to control for such aging effects.
11 For a discussion on redistribution and predistribution, see Blanchard, O., and D. Rodrik, (Eds.). 2021. Combating Inequality: Rethinking Government’s Role. Cambridge: MIT press. See also Blanchet, T., Chancel, L. Gethin, A. « Why is Europe More Equal than the US?” American Economic Journal: Applied Economics, 2021 (forthcoming). See also Bozio, A. Garbinti, B., Goupille-Lebret, J., Guyot, M., and Piketty, T. “Predistribution vs. Redistribution: Evidence from France and the U.S”, World Inequality Lab working paper 2020/22.
12 That is, societies with a nobility, a clergy and a labor class. See Piketty, T. 2020. Capital and ideology. Cambridge: Harvard University Press.
13 See also Piketty (2020).
14 See Kuznets, S. 1953. “Shares of Upper Income Groups in Income and Savings.” New York: National Bureau of Economic Research; Atkinson, A. B., and A. J. Harrison. 1978. Distribution of Personal Wealth in Britain. Cambridge: Cambridge University Press
15 See Piketty, T. 2001. Les hauts revenus en France au XXème siècle. Paris: Grasset; Piketty, T. 2003. “Income inequality in France, 1901–1998.” Journal of political economy, 111(5), 1004-1042; Piketty, T., and E. Saez. 2003. “Income inequality in the United States, 1913–1998.” The Quarterly Journal of Economics, 118(1), 1-41.
16 See e.g. Piketty, T. 2014. Capital in the Twenty-First Century. Cambridge: Harvard University Press; Alvaredo, F., L. Chancel, T. Piketty, E. Saez, and G. Zucman. 2018. World Inequality Report 2018. Cambridge: Harvard University Press.
17 See Blanchet, T., L. Chancel, I. Flores, M. Morgan et al. 2021. “Distributional National Accounts Guidelines, Methods and Concepts Used in the World Inequality Database.” World Inequality Lab.
18 See United Nations Development Programme (UNDP). 2019. “Beyond Income, Beyond Averages, Beyond Today: Inequalities in Human Development in the 21st Century”. New York: UNDP; see also Germain J.-M. et al. 2021. “Rapport du groupe d’experts sur la mesure des inégalités et de la redistribution.” INSEE.
19 Chetty, R., J. N. Friedman, N. Hendren, M. Stepner and The Opportunity Insights Team. (2020). “How did COVID-19 and stabilization policies affect spending and employment? A new real-time economic tracker based on private sector data.” Cambridge: National Bureau of Economic Research.
20 See Wheaton, L., S. Minton, L. Giannarelli and K. Dwyer. 2021. “2021 Poverty Projections: Assessing Four American Rescue Plan Policies”. Washington, DC: Urban Institute, 500.
21 See Clark, A., C. D’Ambrosio, and A. Lepinteur. 2020. “The Fall in Income Inequality during COVID-19 in five European Countries”. Working Paper 565, ECINEQ, Society for the Study of Economic Inequality; Palomino, J. C., J. G. Rodrıguez, and R. Sebastian. 2020. “Wage inequality and poverty effects of lockdown and social distancing in Europe”. European Economic Review 129, 103564. October; Almeida, V., S. Barrios, M. Christl, S. De Poli, A. Tumino, and W. van der Wielen. 2020. “Households’ income and the cushioning effect of fiscal policy measures during the Great Lockdown”. JRC Working Papers on Taxation & Structural Reforms 2020-06, Joint Research Centre; Brunori, P., M. L. Maitino, L. Ravagli, and N. Sciclone. 2020. “Distant and Unequal. Lockdown and Inequalities in Italy”. Technical Report wp2020, Universita’ degli Studi di Firenze, Dipartimento di Scienze per l’Economia e l’Impresa; O’Donoghue, C., D. M. Sologon, I. Kyzyma, and J. McHale. 2020. “Modelling the Distributional Impact of the COVID-19 Crisis*”. Fiscal Studies 41 (2), 321–336. For a review of these studies, see Stantcheva, S. 2021. “Inequalities in the Times of a Pandemic”, Economic Policy, 73rd Economic Policy Panel Meeting, April.
22 Bounie, D., Y. Camara and J. W. Galbraith. 2020. “Consumers’ Mobility, Expenditure and Online-Offline Substitution Response to COVID-19: Evidence from French Transaction Data”. Available at SSRN 3588373.
23 See Voituriez T, and L. Chancel. 2021. “Developing countries in times of COVID: Comparing inequality impacts and policy responses”, World Inequality Lab. Issue Brief 2021/01.
24 See Lakner, C. et al. 2021. “Updated estimates of the impact of COVID-19 on global poverty: Looking back at 2020 and the outlook for 2021”, World Bank.
25 See Voituriez and Chancel (2021) for a longer discussion.
26 See also Voituriez and Chancel (2021).
27 See United Nations Development Programme (UNDP). 2020. “COVID-19 and Central Asia: Socio- economic impacts and key policy considerations for recovery”. New York: UNDP; United Nations Development Programme (UNDP). 2020. “COVID-19 and the countries of South Caucasus, Western CIS and Ukraine Implications for Business Support, Employment and Social Protection Policies and Programming for Sustainability.” New York; United Nations Development Programme (UNDP). 2020. “Analysing long-term socio-economic impacts of COVID-19 across diverse African contexts.” New York; United Nations Development Programme (UNDP). 2020. “The next frontier: Human development and the Anthropocene. Human Development Report 2020.” New York.
28 See Jain, R., J. Budlender, R. Zizzamia, I. Bassier. 2020. “The Labor Market and Poverty Impacts of COVID- 19 in South Africa”. CSAE Working Paper WPS/202014, Center for the Study of African Economies, Cambridge: Harvard University Press.
29 Stiglitz, J. E., A. K. Sen, and J.-P. Fitoussi. 2009. Rapport de la Commission sur la mesure des performances économiques et du progrès social.
30 See the June 2021 leak of US billionaires’ individual income and tax. Eisinger, J., J. Ernsthausen and P. Kiel. 2021. “The Secret IRS Files: Trove of Never-Before-Seen Records Reveal How the Wealthiest Avoid Income Tax.” ProPublica. June 8.