“Inequality is a political choice, not a fatality”
We stress on the outset that addressing the challenges of the 21st century seems hardly feasible without large redistribution of income and wealth inequalities. As a matter of fact, the rise of modern Welfare States in the 20th century countries which was associated with enormous progress in health, education and opportunities for all, was associated with steep progressive taxation to ensure that everybody contributed to the public good according to their own capabilities.
Parts of this chapter are adapted from T. Piketty “A brief history of inequality” (2022), Harvard University Press
The 20th century was marked by a remarkable increase in social progress, redistribution, and economic emancipation policies in high-income countries. This vast movement both benefited from and contributed to the “Golden age of growth” in the West observed between 1950 and 1980. Since the early 1980s, the rise of the Welfare State has come to a halt in rich countries while inequality has been increasing in most countries. In developing and emerging countries, the rise of social spending and redistribution was relatively slow over the past forty years. While hundreds of millions of people were lifted out of extreme poverty, hundreds of millions of individuals still struggle to earn subsistence income levels1. The weakness of the Welfare State in many parts of the world raises significant issues at a time when important healthcare, education or infrastructure investments are needed to face the challenges of the 21st century.
The rise of the Welfare State in rich countries (1910-1980)
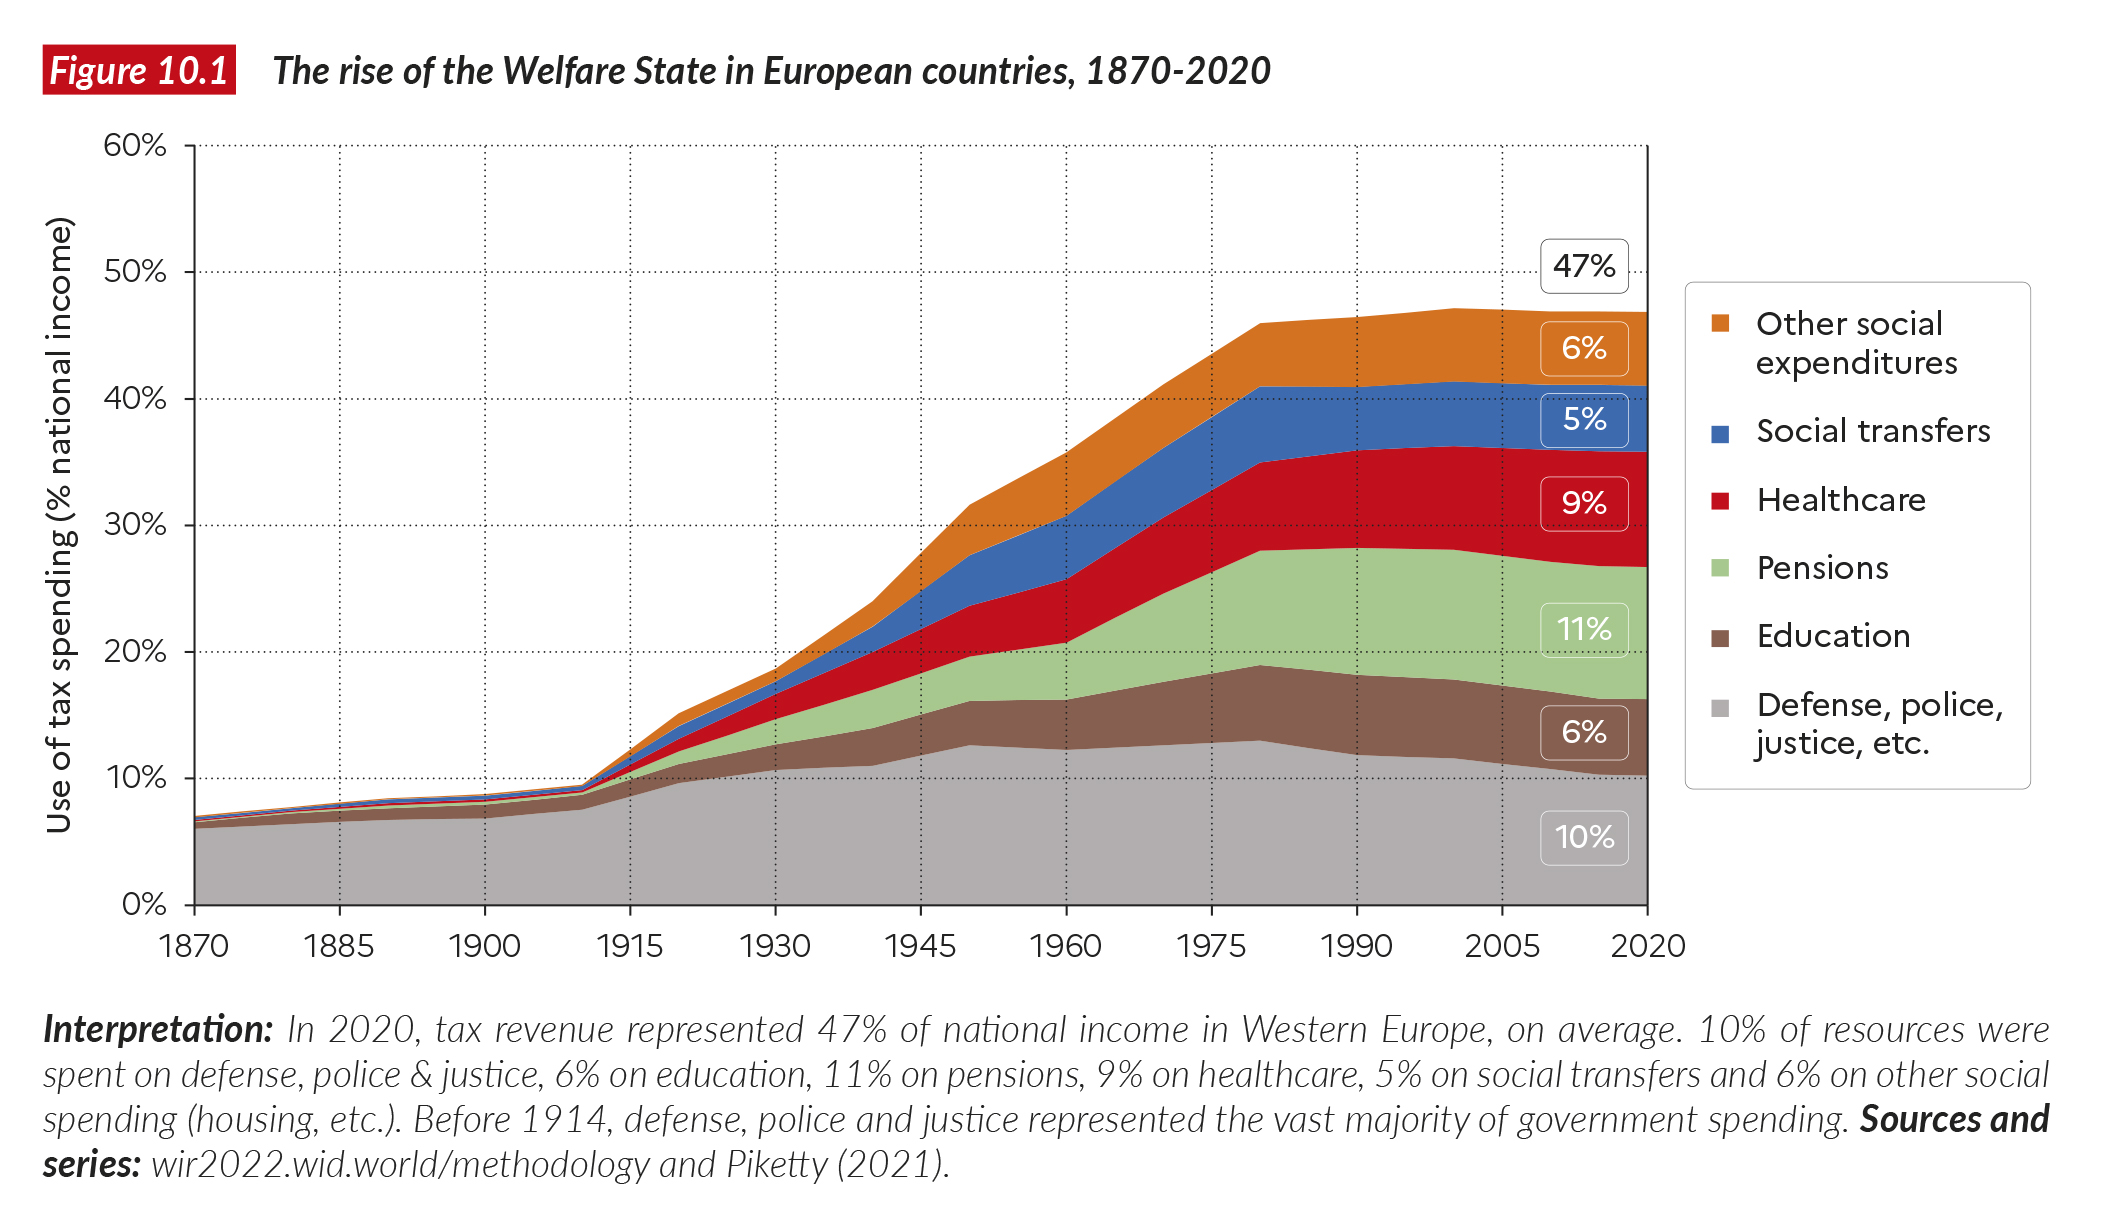
To better understand the policy levers needed to tackle economic, social, healthcare or environmental inequalities, let us first briefly discuss what we mean by “Welfare State”. Welfare States are essentially an invention of the past century. Indeed, at the beginning of the 20th century, total government revenue in rich countries amounted to 5-10% of national income. Revenue was mostly used to fund police, military and administrative functions of governments. Public social spending (on healthcare, education or other forms of support for the worse-off) barely existed. Today, total government revenue account for 30-50% of national income in rich countries and a significant part is allocated to social expenditures (see below). Put differently, a third to a half of all incomes are taxed by governments in rich countries, and a large part of these taxes finds its way back into the economy in the form of social spending.
As a matter of fact, the remarkable increase in tax revenue was coupled with a considerable rise in public education, retirement, and healthcare spending. Public education spending accounted for just 1.2% of national income in 1910 and rose to 6% in 1980 in European countries (Figure 10.1) whereas healthcare spending accounted for 0.2% of national income in 1910 and rose to 7-9% by 1980. Retirement and disability pensions grew from almost nothing in 1910 to about 11% of national income in 2020. Other social spending (including unemployment insurance benefits, family benefits, housing support) were almost inexistent in 1910 and reached 6-7% of national income in 1980. Since 1980, the progress of the Welfare State has halted. There were some moderate increases in healthcare and retirement spending, but considerably lower than those observed before 1980. In North America, if certain social programs were developed or enhanced over the past decades, overall government tax revenue actually declined between 1980 and the eve of the Covid-crisis.
What drove such an increase in taxes and social spending between 1910 and 1980 and why did it stop thereafter? One of the most powerful drives behind this increase has been the historical ground gained by universal suffrage in the West (first extended to all adult males, then to women and minorities) and the development of new political and social mobilization strategies. In the United Kingdom, the Labor Party won an absolute majority of seats in the 1945 elections and set up the NHS (National Healthcare Service) and a far-reaching system of social insurance. The most aristocratic country in Europe, which until the constitutional crisis of 1909 had been ruled by an aristocratic elite sitting in the House of Lords, became the one country in Europe where profound social reforms were implemented by a workers’ party. When Sweden, a country where voting rights used to be based on wealth ownership in the 19th and early 20th centuries, introduced universal suffrage, workers brought the Social Democrats to power almost continuously from 1932. In France, the Popular Front set up paid holidays in 1936, and due to the strong presence of Communists and Socialists in Parliament and in the government, Social Security was imposed in 1945. In the United States, a popular coalition brought the Democrats to power in 1932 with the New Deal, thereby challenging existing laissez- faire dogmas and the power of the elite.
Two observations should be made on the social revolution which happened in rich countries between 1910-1980. To begin with, for the first time in history at this scale, the state escaped the exclusive control of the ruling classes. This laid the foundations of universal suffrage, parliamentary and representative democracy, electoral processes and political alternance, spurred by an independent press and the trade union movement. This democratic revolution was indeed highly imperfect: it is not until the 1950s-1960s that women and minorities got the right to vote in all western democracies, and neither did the colonies. It was nonetheless a radical break from the late 19th and early 20th centuries.
Secondly, it shows that modern societies can escape the generalized commodification of goods, lands and human beings2. Vast sectors of the economy, starting with education and healthcare, and partly housing, transport, and energy, were organized independent of market logic, with various systems of public employment, mutual or non-profit structures, subsidies and tax-financed investments. Not only did it work, but it worked much more efficiently than the capitalist private sector. Even though some lobbyists continue to claim the opposite (for obvious reasons, and sometimes effectively to a certain extent), evidence shows that European- style public systems are both less costly and more efficient in terms of well-being and life expectancy than private companies in the United States3. In the education sector, hardly anyone offered to replace schools, colleges or universities with companies governed only answering to purely capitalist logic. Whatever the disputes and legitimate debates on improvements to be made in these sectors, no major political movement in the West suggested to return to the pre-1914 situation, when tax revenue accounted for less than 10% of national income and public social spending was almost nonexistent.
The limited rise of tax revenue and public spending in emerging countries since 1980
Let us now turn to tax revenue and spending in low-income countries. In many emerging countries, taxes and spending have been increasing over the past forty years, but to a much lesser extent than in the West in the 20th century–for that matter in many low- income countries, government revenue even stagnated or declined.
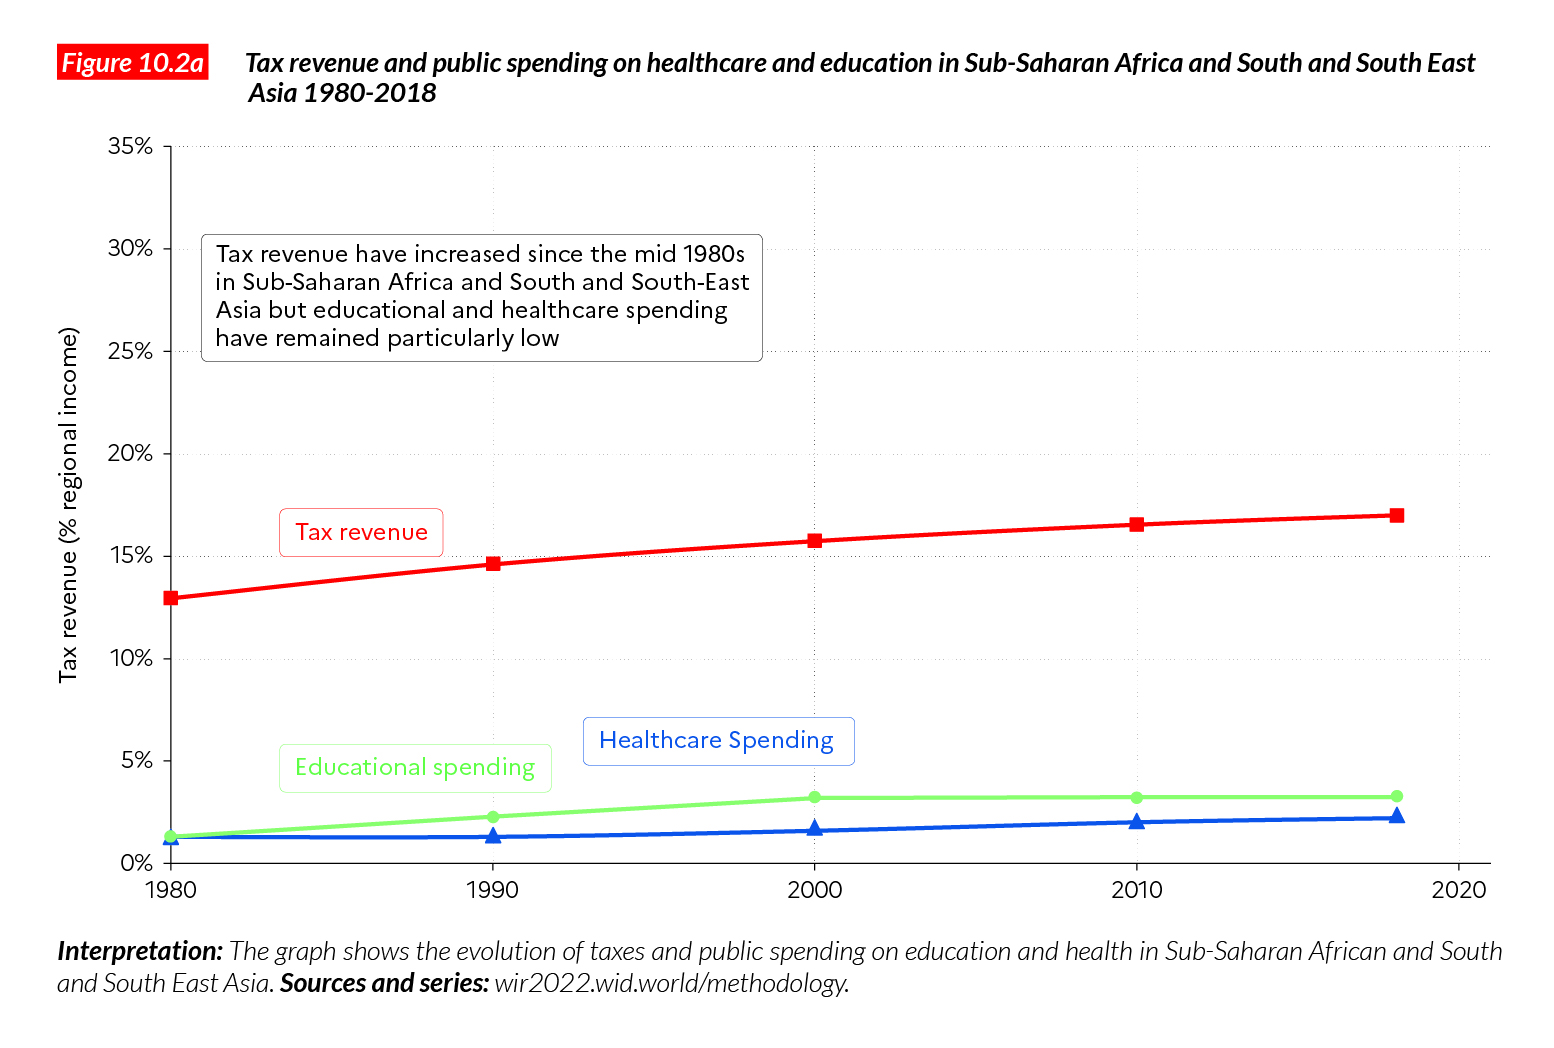
Government revenue in India and China accounted for 10-15% of national income in 1980, i.e. the same level as in rich countries about 60 years before. Since 1980, government tax revenue in these countries has risen to 15-20% of national income. While this represents a significant increase, it has been much slower than the increase observed in rich countries between 1920 and 1960 (where government revenue rose from 10-15% to 30-35% of national income). In Russia and Central Asia, revenue declined from 35% in the mid-1990s, after the collapse of the Soviet Block, to 30% today. In Sub Saharan Africa, tax revenue decreased over the same period, from a little less than 19% to 15%.
Spending on healthcare and education generally follow the overall pattern of tax revenue: an increase in tax revenue means an increase spending in these areas. Public spending increased in emerging countries, such China and Brazil, between 1980 and 2020 (from around 1% to 4% of national income). This increase certainly contributed to combatting extreme poverty, containing inequality and generating new income growth opportunities in these countries4. Over the same period of time, spending also increased in the rest of Latin America, but was much more limited in South East Asia. In India, it went from slightly below 1% to slightly over 1% of national income and increased from 1% to 1.8% in Indonesia. Overall, since 2000, public healthcare spending has decreased in low- income countries, from around 1.3% to 1% of national income5.
Lessons from failed trickle-down economics
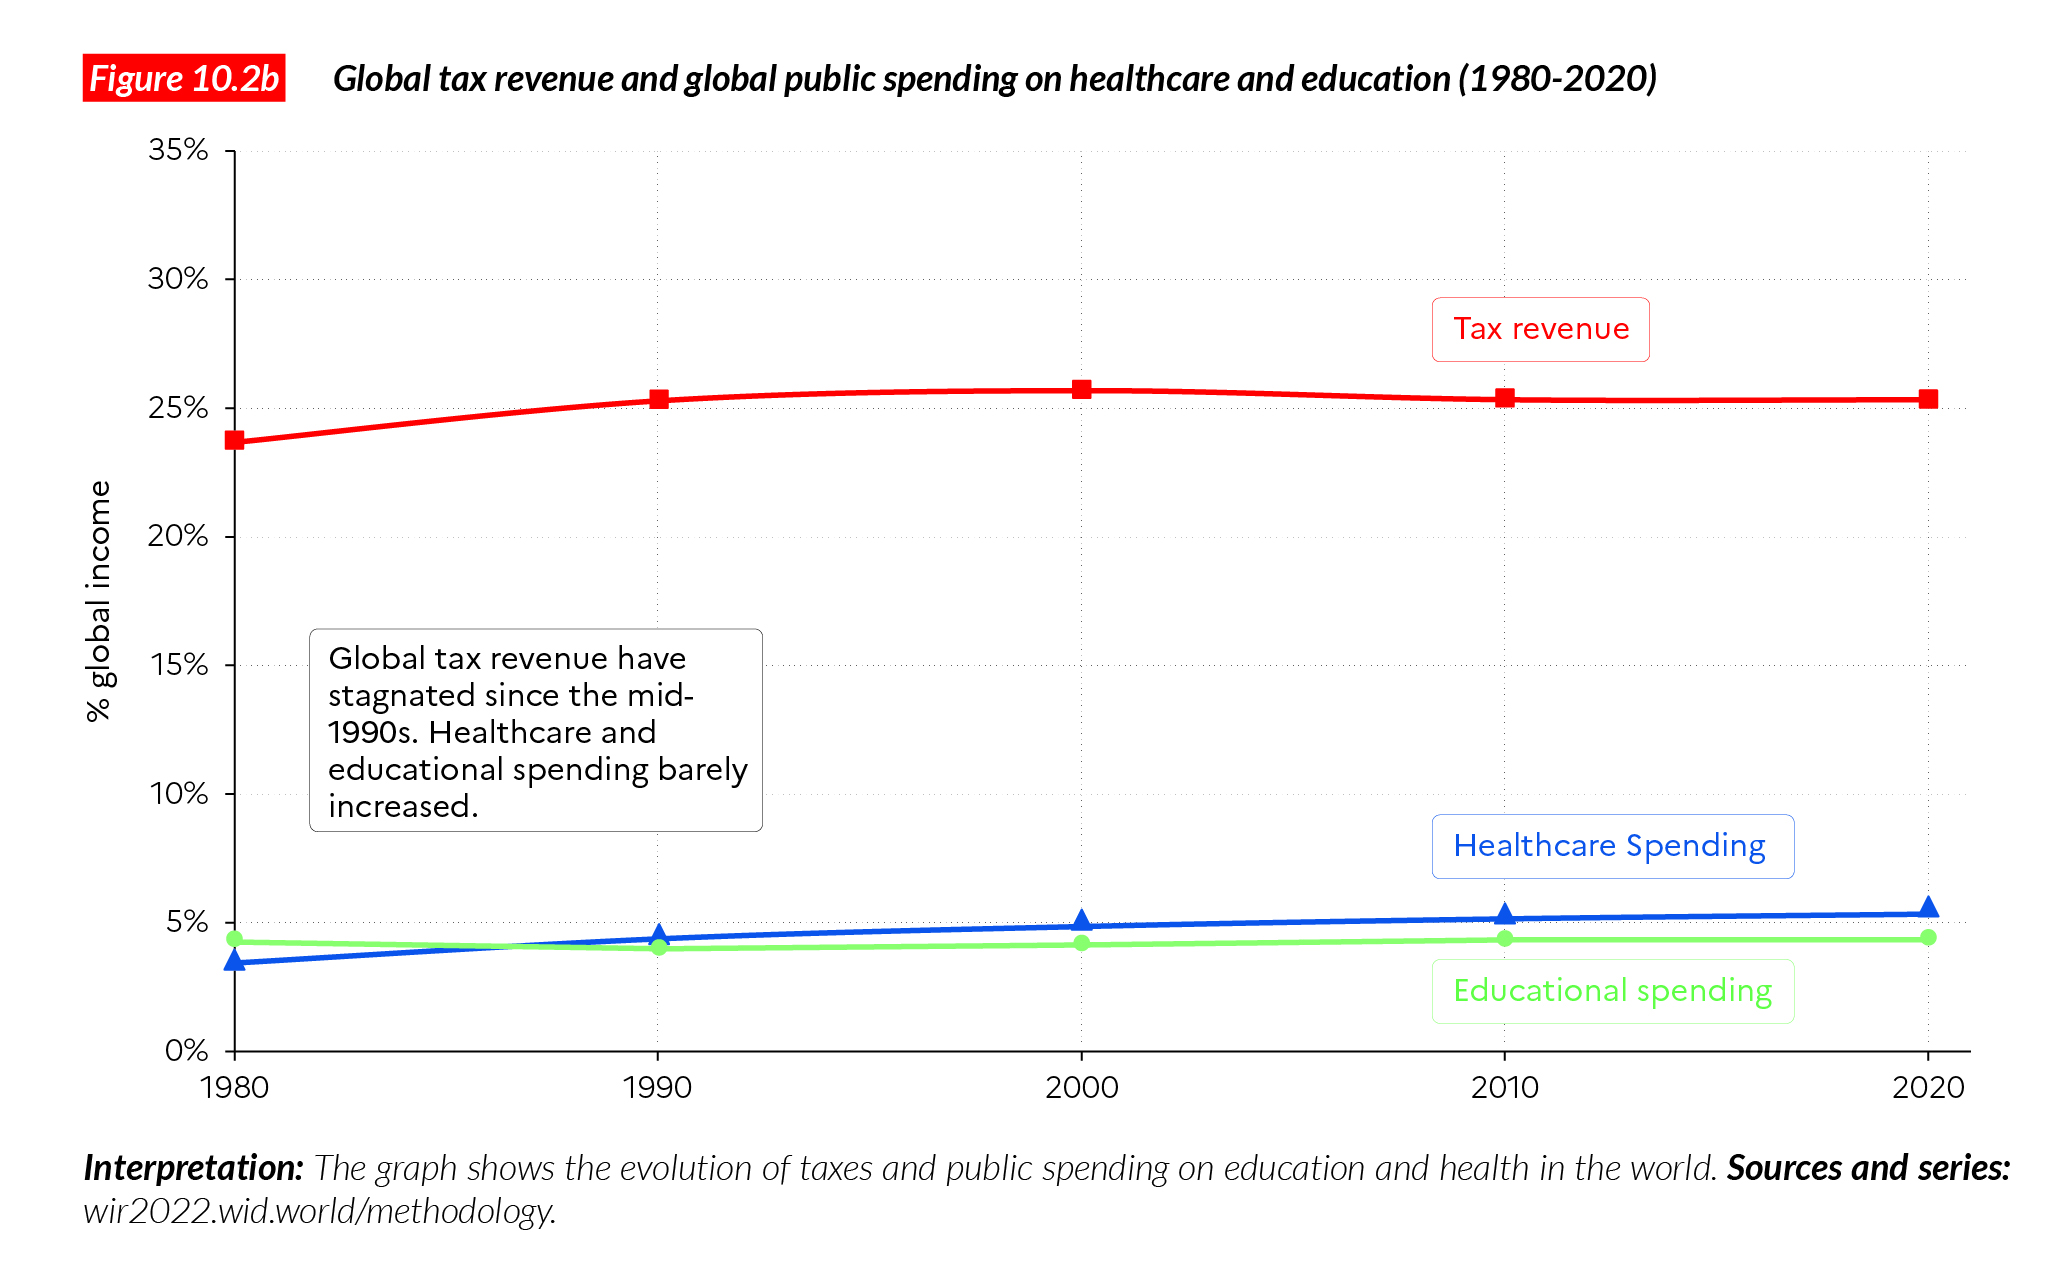
Why has global tax revenue stagnated – and why has spending on education and increased ever so slightly since the 1980s? One of the main reasons for limiting tax revenue is that taxes curb economic growth. Taxation, it is argued, distorts economic incentives, which therefore prevents markets from functioning properly and reaching their full potential. Obviously, some taxation levels hamper economic activity. However, evidence shows that periods of tax expansion in high-income countries have not harmed economic growth. As a matter of fact, periods of tax expansion and high progressive taxation boosted Europe and the USA in terms of growth and employment more than periods of low tax progressivity or tax stagnation.
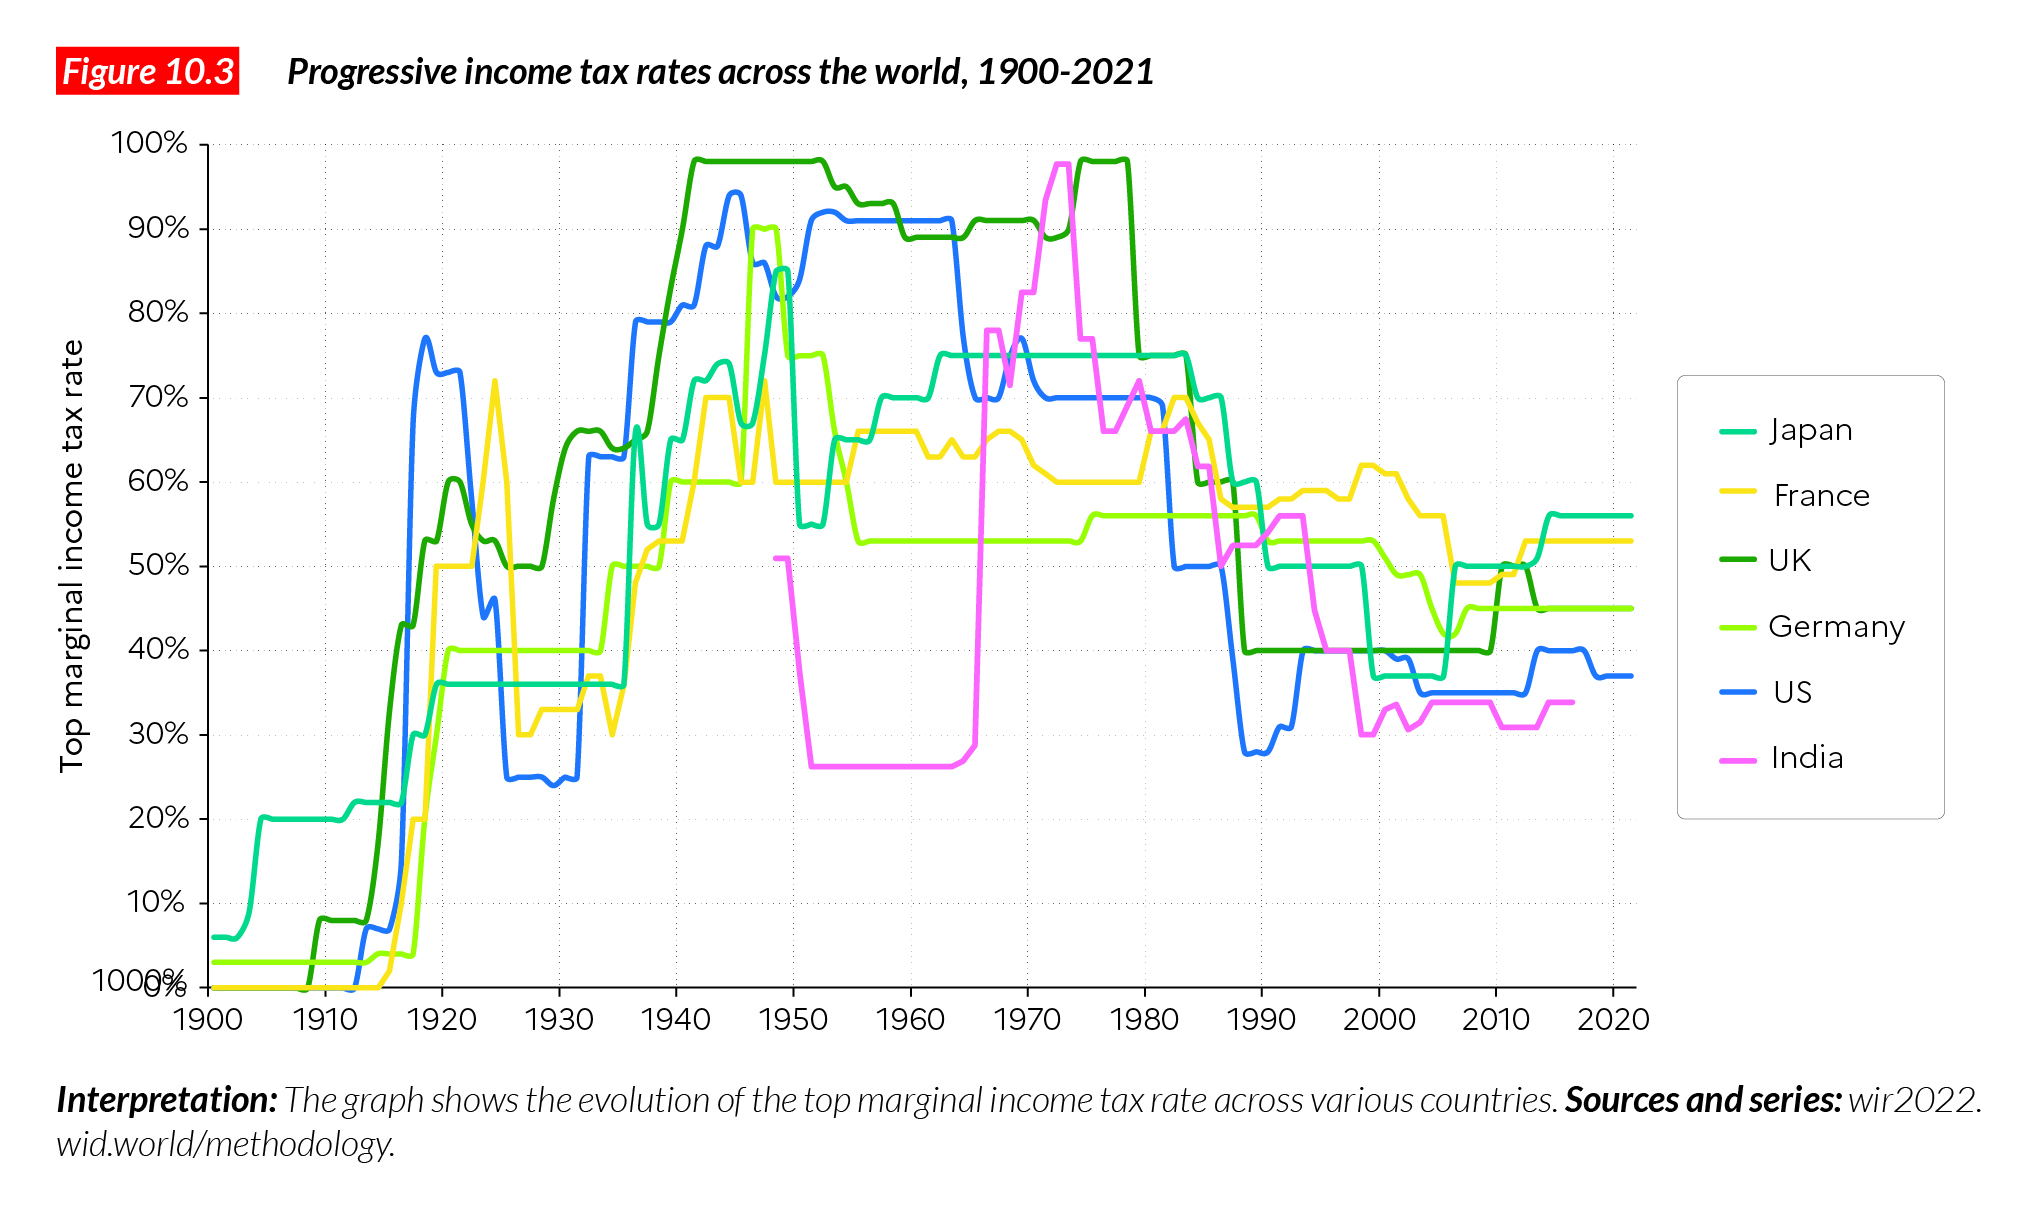
Tax expansion and social spending in the West was accompanied by steep increases in progressive taxes. Progressive tax rates (whether on income or capital) allowed economic actors to be taxed based on their capabilities, thereby generating a significant amount of revenue. Progressive taxation also helps to ensure that tax systems appear fair to taxpayers. Historically, legislators across the world have coupled the general rise of government revenue with highly progressive taxes. Between 1950 and 1980, the average top marginal income tax rate in high-income countries amounted to 72%. In the USA, this average reached 92% between 1951 and 1963, and the top estate tax rate averaged 80% between the early 1940s and the mid- 1970s. High rates were also observed in the UK, Germany, Japan, as well as in France and in other high-income or emerging countries (see Figure 10.3).
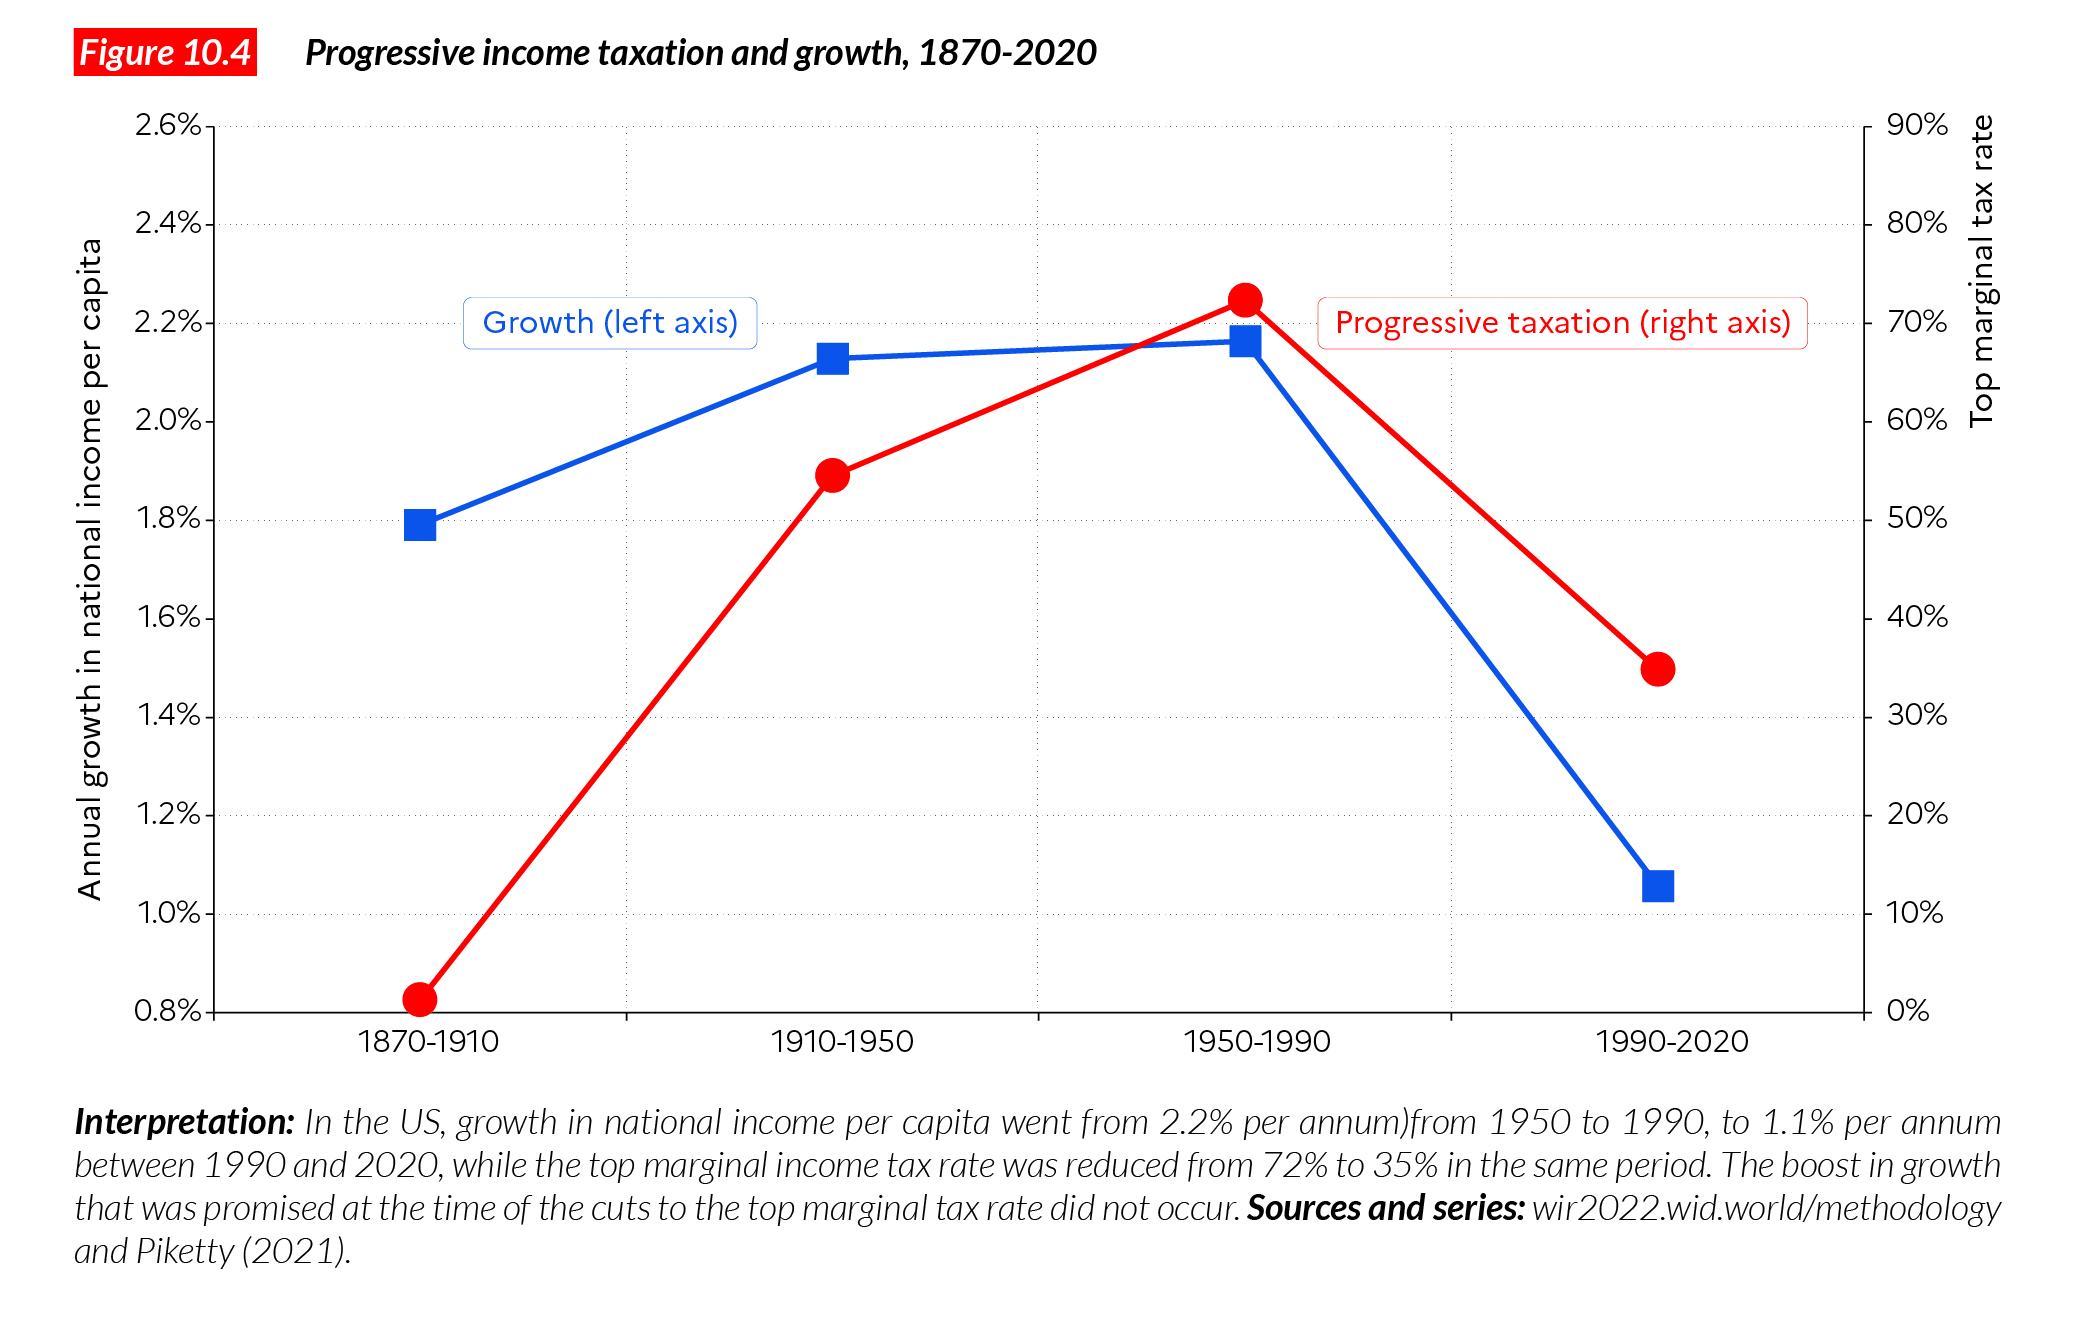
Figure 10.4 shows that after the USA’s top income earners saw their taxes
reduced substantially in the 1980s, GDP growth has not increased. Incidentally, growth has been significantly lower after these sizeable tax cuts rather than before them. Many factors, other than tax rates (educational expenses, labor regulations, industrial policy, etc.), impact macroeconomic growth rates, but the large-scale, real-life tax experiments carried out over the 1980-2020 period suggest that trickle-down economics has not lived up to its promises. The lack of clear linkages between tax cuts for the wealthy and positive effects on growth and employment has also been demonstrated in recent theoretical and empirical studies carried out in many countries7.
Drawing on the lessons learned from the failure of trickle-down economics suggests adopting a much more pragmatic approach to taxation, based on a sound and transparent empirical analysis of taxation.
The 1980-2020s have been marked by a rise of tax evasion, further undermining tax progressivity
Another reason explaining why social expenditures recorded a sluggish growth across the world is the rise of tax evasion, which has undermined tax progressivity as well as overall support for taxation. Some wondered: “If certain taxpayers can evade taxes, why should we pay any?”. The ascent of tax evasion has been facilitated by the rise of financial globalization and the liberalization of cross-border capital flows (with no tax, social or regulatory counterparts). Between 1995 and 2020, global financial assets rose from 540% to 960% of global income and increased faster than aggregate wealth8. In other words, the global economy is increasingly financialized. This rise occurred with little or no government control over financial flows and paved the way for tax evasion from wealthy individuals and multinationals9.
Nowadays, global household wealth held in tax havens is estimated at around 10% of global GDP. While there is limited empirical data to prove this, available evidence suggests that global offshore wealth has significantly increased since the 1980s. In 1980, less than 2% of US equity market capitalization was booked in tax havens and this percentage rose close to 10% in the early 2010s.10
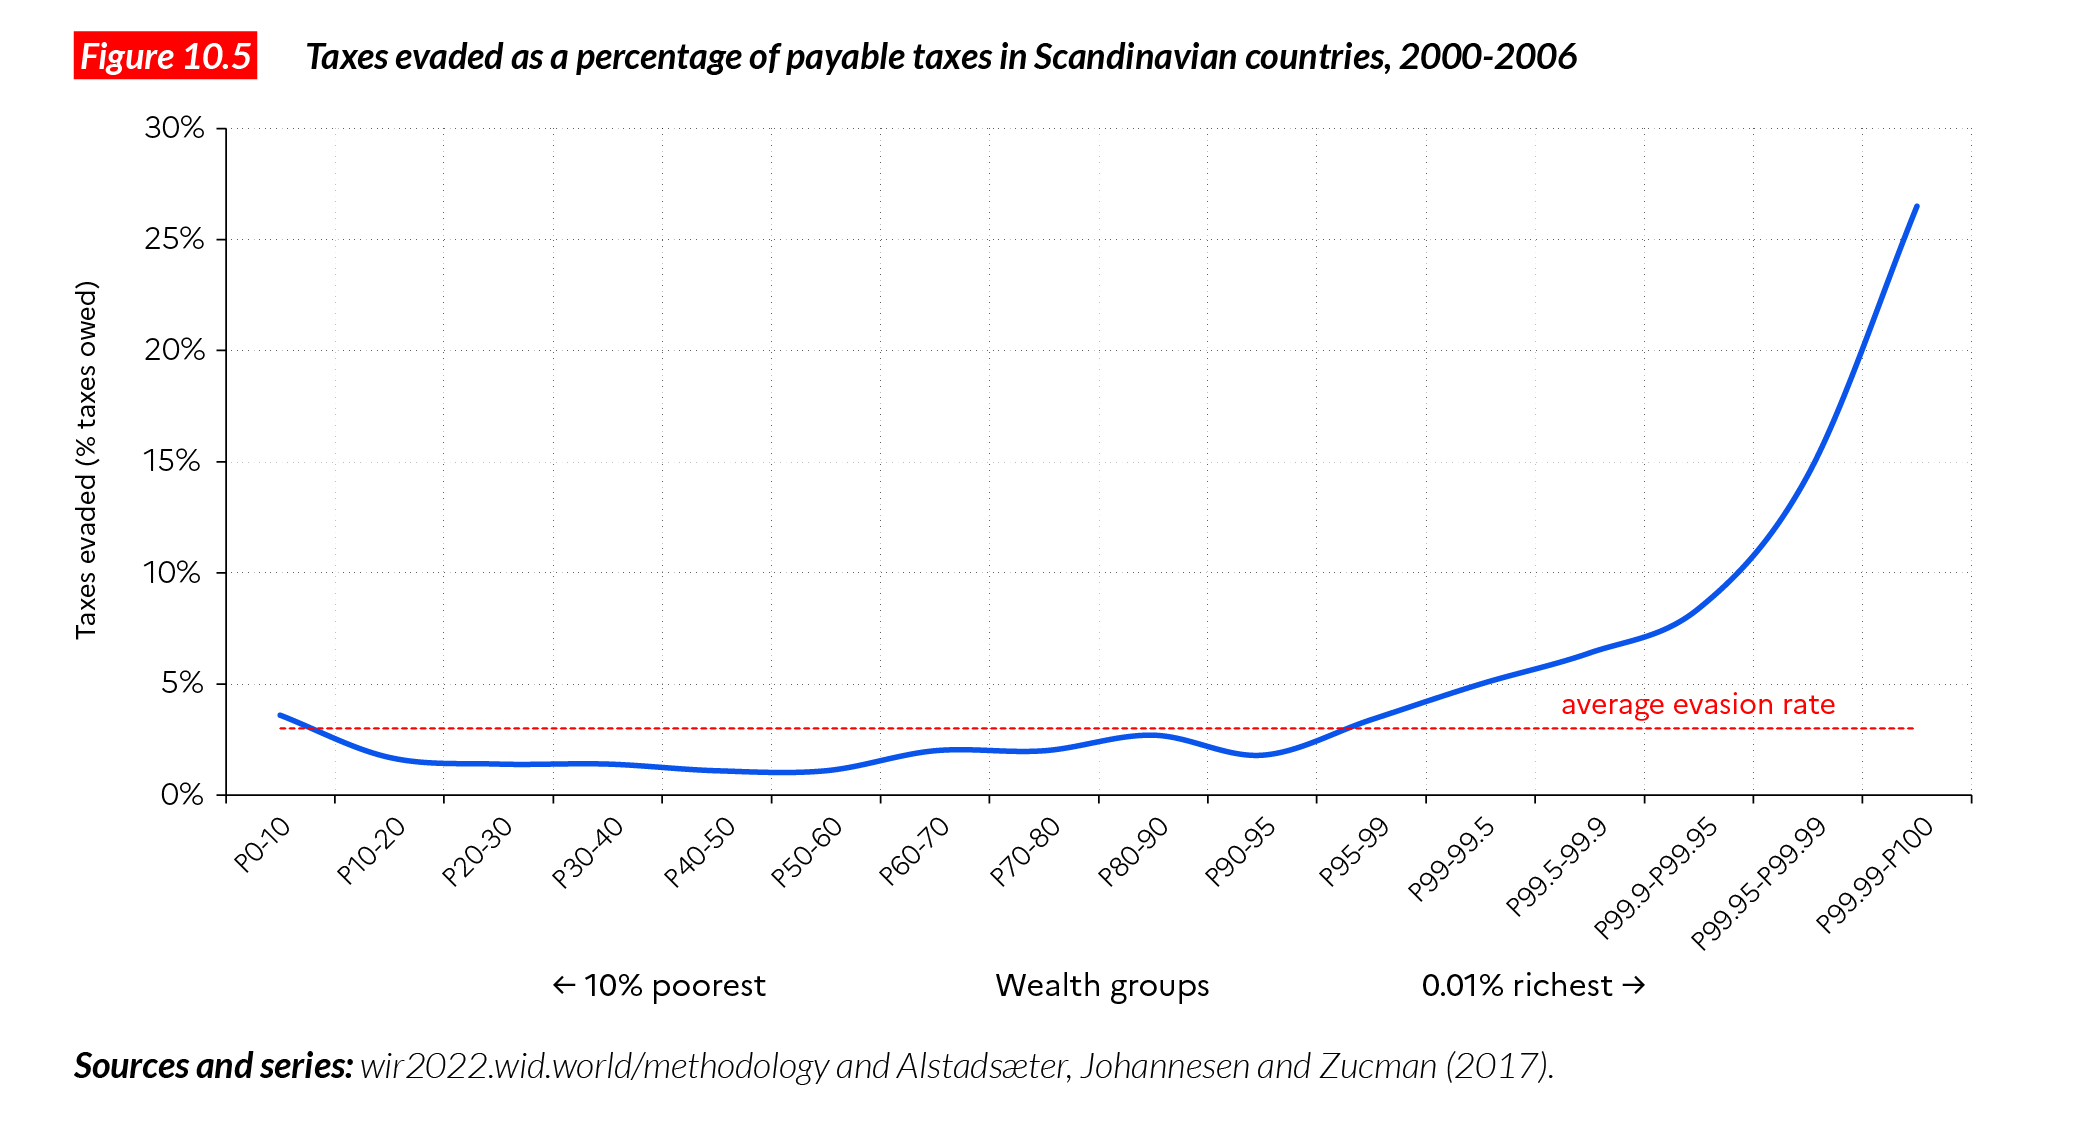
While governments have been extremely slow to recognize the scale of the challenge– and in many cases encouraged offshore tax evasion–civil society has been working relentlessly to measure and better understand tax evasion. Offshore tax evasion has been drawing a lot of attention in recent years, partly thanks to international media and research consortiums, which released a series of leaked information about tax evasion (the “Panama papers”, “HSBC leaks”, “LuxLeaks”, etc.). Recent research, drawing resources from these leaks, has demonstrated that tax evasion has undermined tax progressivity across the world. Most of the population in advanced economies does not evade much tax—because most of its income derives from wages and pensions, which are automatically reported to the tax authorities. On the contrary, leaked data shows pervasive tax evasion at the very top of the distribution. The top 0.01% of Scandinavian income earners avoid paying 25% to 30% of their personal income taxes, which is significantly higher than the average evasion rate of about 3% (See Figure 10.5)11. Because Scandinavian countries rank among the countries with the highest social trust, the lowest level of corruption, and the strongest respect for the rule of law, this suggests that evasion among the wealthy may be even higher elsewhere.
Using 21st-century progressive tax revenue to invest in education, healthcare and the environment
Looking back at the decades of global tax revenue stagnating and factoring in the various challenges faced by contemporary
societies (in particular in matters of healthcare, education, environment), there appears to have sufficient room for strengthening social states across the world, primarily in low-income and emerging countries, but also in high-income countries which have significant investment needs.
The wealth taxes suggested in Chapter 7 can provide the necessary resources to increase public spending. At the global level, our first wealth tax scenario could increase global public healthcare spending by 25%– this represents a substantial increase in healthcare spending even with moderate wealth tax rates. A combination of personal wealth taxes and taxes on corporate income could multiply healthcare spending by 1.5-2.
Sectors such as education and the green transition (low-carbon transport, energy and production infrastructures) will also require significant public investments across the world in the decades to come (See Chapter 6). Each country should choose how to use wealth taxation to their benefit. The bottom line is that governments should set measurable additional investment targets in terms of education, healthcare and green transition. Progressive wealth taxes are critical instruments to reach these objectives.
Global redistribution: moving beyond development aid
In emerging and developing countries, a lot of focus has been placed on development aid (be it by foreign countries or philanthropists), as a means to increase access to healthcare and education. Too often though, foreign aid has come at the expense of sustainable tax revenue for poor countries. Global development aid currently accounts for less than 0.2% of global GDP today (and a mere 0.03% for emergency aid). To put these values into perspective, climate change impacts in poor countries (mostly caused by the Global North so far) amount to several percentage points of GDP. It should also be noted that in most countries receiving development aid, be it in Africa, South Asia or other regions, money outflows, taking the form of multinational profits, are by far superior to public aid inflows. According to official data, capital income flowing from African countries to the rest of the world represented on average three times the amount of international aid flowing into African countries between 1970 and 2012, and the situation has not significantly changed since then12. In other words: rich countries pretend to help poor nations, but all things considered they actually benefit from how economic flows are organized between the “center” and the “periphery”.
When considering issues such as international aid and global development, it appears critical to take into account the various dimensions of the problem. Focusing solely on public (or private) development aid and disregarding important capital flows prevents a proper understanding of the global economic system. Let us add that aid is always conditional on the will of a donor country and transferred via its own development agencies or NGOs. While modest overall, development aid can represent substantial amounts in certain countries, particularly when compared with tax revenue. In many countries, the work of development agencies and NGOs have contributed to weaken the State-building process. This was particularly the case in the Sahel region in the 1950-60s, where government actors were never fully recognized and accepted by local actors following independence. Development aid in the form of new tax resources could probably contribute to strengthening government actors, but foreign aid given in the context of a weakening of governments can hardly be of help to them13.
Box 10.1 One-off wealth taxes: a window of opportunity?
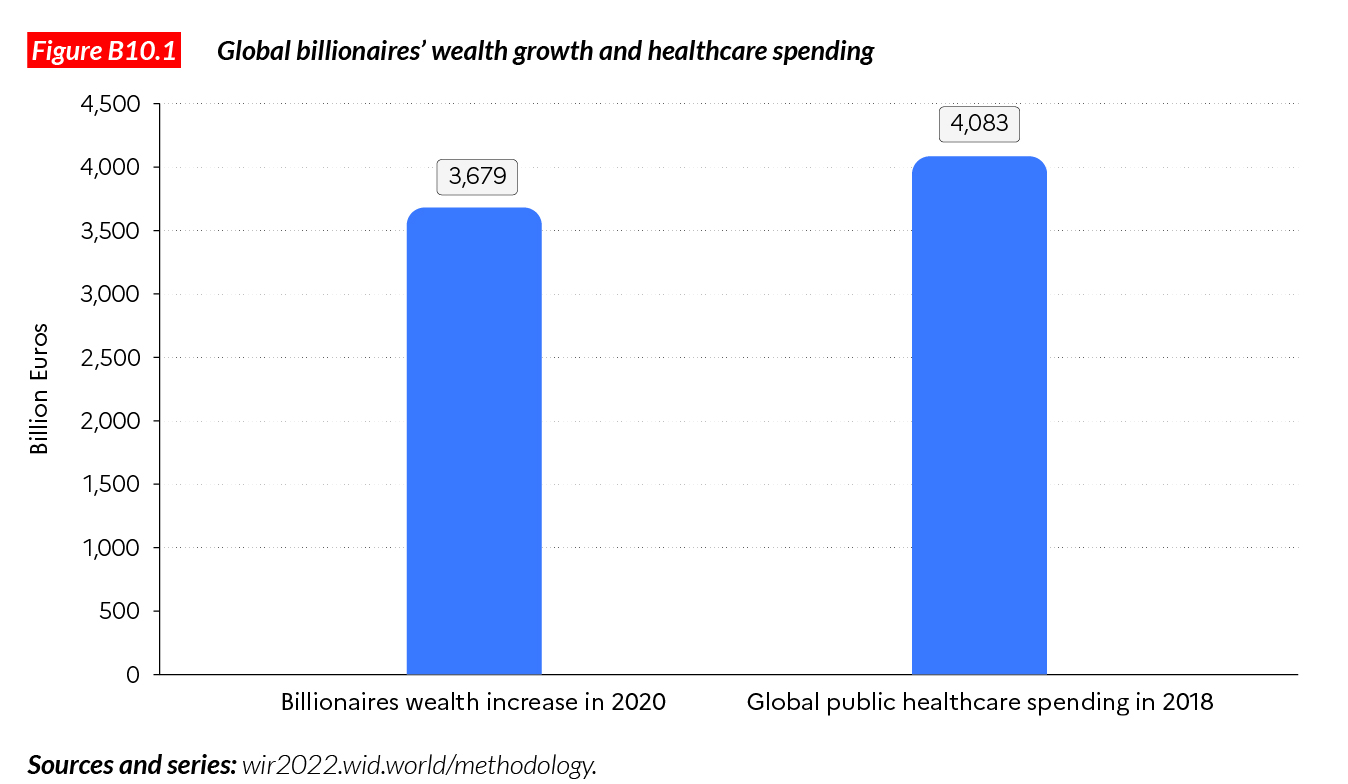
On top of recurrent wealth taxes, governments can also implement one-off wealth taxes. In 2020 alone, global billionaires’ wealth increased by more than €3,600 billion (€3.6 trillion). Had a global tax been applied on excess wealth for 2020, global billionaires would still be as rich today as they were on the eve of the pandemics and would almost double global healthcare spending in a year (Figure B10.1). Excess wealth taxes were implemented in the past in the aftermath of economic or political shocks to help societies recover and invest in the future. For instance, Germany and Austria implemented exceptional taxes on property in the 1920s for reconstruction after World War I, and Japan did so after World War II.
Ending center-periphery imbalances
To put an end to large imbalances in capital and income flows between the Global North and the Global South, it is necessary to reassess the basic principles of globalization. It is not unreasonable to assume that each country in the world should have equal rights to development, in the sense that each human being should have equal access to basic education and healthcare services to start with. The question of how to fund such basic services is entirely political, thereby depending on the set of rules and institutions put in place by societies across the world.
Starting from these basic principles and recognizing the need to fund access to basic resources, it appears logical that resources derived from the wealth taxes posited in Chapter 7 could be partly allocated to the Global South. The prosperity of the world’s most performing economic actors over the past decades has entirely depended on the fact that they were operating in international markets and therefore on the international division of labor. This is a strong argument in favor of a global distribution of their gains.
In the least ambitious wealth tax scenario in Chapter 7, about 2% of global GDP would be raised, that is already 10 times more than all development aid flows accruing to low-income and emerging countries. On top of a share of wealth tax revenue, it is also possible to allocate to low-income countries a share of the revenue generated by multinationals’ taxation (See Chapters 8-9). To prevent any form of fraud and corruption with funds used, much more resources should be dedicated to the fight against tax evasion, both in the South and in the North, focusing on public actors as well as private actors. In case of corruption, there is typically a corruptor, or actors directly or indirectly benefitting from tax evasion. These actors are often located in the North.
International aid could then continue to be transferred to low-income countries. But this would be in addition to important additional tax revenue collected by emerging countries. Perhaps one of the main problems with current international aid is that it is assumed that the international economic order is fundamentally fair, in other words that each country is the legitimate owner of the resources it has produced. In Chapter 2, we saw that the rise of the Western world since the Industrial Revolution has been conditional to the international division of labor and the large-scale exploitation of natural resources all over the world. More broadly, rich countries would not exist without poor countries and global environmental resources. This applies both for Western powers and for Asian powers today. After slaves, cotton, wood and coal in the 18th and 19th centuries, economic development in the 20th and 21st century is still based on the depletion of global resources and the use of extensive, cheap manpower in low-income countries.
Chapter 2 also revealed the widespread idea according to which each country (or each individual within each country) is individually responsible for its production (and therefore its income), and outlined that wealth does not make much historical sense. For a start, resources do not belong to any country or individual. Private property is established (or should be established) only insofar as it serves the general interest, within the framework of a balanced set of institutions and rights limiting individual build-up of wealth and achieving a better distribution of wealth. The fear of not knowing where to stop in such a political process is understandable, especially at the transnational level. At such a level, there is often considerable prejudice and the social groups involved do not know each other well. They may consequently have difficulty properly considering each other’s values and respective situations, which makes the search for a common standard of justice even more complex, uncertain, and as fragile as it is essential. The trade-offs and mechanisms that will be found, such as reparations or the global taxes mentioned here, will always be imperfect and temporary. But alternatives, such as making sacrosanct the market and the absolute respect of property rights acquired in the past (whatever their scale or origin), are only inconsistent arrangements aimed at perpetuating injustices and unfounded positions of power, ultimately only preparing for new crises.
Box 10.2 Unequal access to healthcare: How the Covid crisis revealed and exacerbated healthcare inequalities between countries
A survey carried out in seven developing countries (Afghanistan, Bangladesh, the Democratic Republic of Congo (DRC), Haiti, Nepal, Senegal and Tanzania) strikingly estimated that less than a third of clinics and healthcare centers in Bangladesh, the DRC, Nepal and Tanzania had access to face masks at the onset of the Covid crisis in 202015. While the US had about 33 intensive care unit (ICU) beds per 100,000 population when the pandemic broke out, the ratio was at around 2 per 100,000 in India, Pakistan and Bangladesh in South Asia. In Sub-Saharan Africa, the situation was even worse: Zambia for instance had 0.6 ICU beds per 100,000, Gambia 0.4, and Uganda 0.116. In 43 African countries, the total number of ICU beds was at about 5 per million, against 4,000 per million in Europe17. Ventilators barely reached 2,000 in all 41 African countries as of mid- April. 10 African countries had no ventilators at all, compared with 170,000 respirators in the USA in mid-March18. There were blatant inequalities in healthcare systems, with 0.2 physicians and 1.0 nurse per thousand people in low-income countries, compared to 3.0 and 8.8 respectively in high-income countries19.
General government healthcare expenditures expressed as a share of GDP actually shrunk in low-income countries between the pre-financial crisis (2006-2008) situation and the pre-covid crisis (2016- 2018). The opposite occurred in OECD countries and middle-income countries. The financial crisis of 2008-2009 exacerbated the long-run discrepancy in public healthcare expenditure between rich and poor countries even though such discrepancy might also occur within the middle and high-income groups. A comparison with total healthcare expenditures (including expenditures funded by private sources) reveals that out-of-pocket spending increased in low-income countries to compensate for the decline in public expenditures in relation to GDP. The decline was even sharper among vulnerable and conflict-affected countries.
The reasons behind developing countries’ weak healthcare systems have long been debated. The lack of public resources in the context of imbalanced international flows is part of the equation. The IMF and World Bank’s structural adjustment programs in developing countries have also been called into question. In certain places, it has arguably led to underinvestment in systems, which in turn undermined their capacity to respond to the Ebola epidemic20.
Public finance has followed a different course. In high-income countries, government revenue (including taxes, non-tax revenue, grants and social contributions, expressed as a share of GDP) grew by 1.7% between 2006- 2008 and 2016-2018. Low-income countries government revenue remained twice as low, at around 19%. Middle-income countries governments saw their revenue decrease by more than 3% over the same period. These discrepancies hide regional differences. Revenue receded by 14% in MENA and by 13.5% in Sub-Saharan Africa. Before the Covid crisis hit, general government revenue was below 20% of GDP in Western Central and Eastern Africa, reducing the room for maneuver in the face of emergency spending.
1 The number of global extreme poor (living with less than $1.9 per day) decreased from 1.9 billion in 1990 to 730 million in 2020 according to the World Bank.
2 Esping-Andersen, G. 1990. The Three Worlds of Welfare Capitalism, Cambridge: Polity Press; Polanyi, K. 1944. The Great Transformation. New-York: Farrar & Rinehart.
3 Michaud, P.C. et al. 2011. “Differences in Health Between Americans and Western Europeans”, Social Science & Medicine; Roser, M. 2017. “Link Between Healthcare Spending and Life Expectancy: US is an Outlier”, OurWorldInData; Case, A. and A. Deaton. 2020. Deaths of Despair and the Future of Capitalism, Princeton: Princeton University Press.
4 For more in depth discussion of inequality dynamics in China and Brazil, see Alvaredo, F., L. Chancel, T. Piketty, E. Saez, G. Zucman. 2018. World Inequality Report 2018, Cambridge: Harvard University Press.
5 Low-income countries as per World Bank definition, i.e. per capita Gross national income less than $1,045.
6 We estimate global tax revenues at around 5% of global income in 1900, 20% in 1950 and 25-27% in 1980.
7 Diamond, P. and E. Saez. 2011. “The Case for a Progressive Tax: From Basic Research to Policy Recommendations.” Journal of Economic Perspectives, 25 (4): 165-90. France Stratégie. 2020, Comité d’évaluation des réformes de la fiscalité du capital.
8 Global financial assets represented 145% of global wealth in 1995 and 180% in 2020.
9 See Pistor, K. 2019. The code of capital. How the Law Creates Wealth and Inequality. Princeton: Princeton University Press; Piketty, T. 2020. Capital and Ideology, Cambridge: Harvard University Press.
10 Alstadsæter, A., Johannesen, N., and G. Zucman. 2018. “Who owns the wealth in tax havens? Macro evidence and implications for global inequality”. Journal of Public Economics, 162, 89-100; Zucman, G. 2013. “The missing wealth of nations: Are Europe and the US net debtors or net creditors?”. The Quarterly journal of economics, 128(3), 1321-1364.
11 Alstadsæter, Johannesen, and Zucman. “Who owns the wealth in tax havens?”; Zucman. “The missing wealth of nations”.
12 Piketty, T. 2014. Capital in the 21st century. Cambridge: Harvard University Press.
13 Mann, G. 2015. From Empires to NGOs in the West African Sahel: The Road to Nongovernmentality. Cambridge: Cambridge University Press.
14 Recent developments in the fight against tax evasion (with facilitated exchanges between the tax authorities) go in the right direction. However, absent detailed information on tax rates paid by various individuals within countries it is impossible to demonstrate that there are effectives changes.
15 Gage, A., and S. Bauhoff. 31 March 2020. “Healthcare systems in low-income countries will struggle to protect healthcare workers from covid-19”. Center for Global Development.
16 See Voituriez and Chancel. “Developing countries in times of COVID”.
17 Chowdhury, A. Z., and K. S Jomo. 2020. “Responding to the COVID-19 pandemic in developing countries: Lessons from selected countries of the global South”. Development, 63(2), 162-171.
18 For references, see also Voituriez and Chancel. “Developing countries in times of COVID”.
19 See Gage and Bauhoff. Healthcare systems in low-income countries.
20 For references, see also Voituriez and Chancel. “Developing countries in times of COVID”.

